Fact sheets for Colorado congressional districts


I've published a set of fact sheets for congressional districts in Colorado. They are formatted similarly to facilitate comparison. My aim is to provide some high-level context about the demographic and socioeconomic characteristics of different parts of the state as well as how they have changed over time.
There is a great deal of variety across Colorado's congressional districts. Politically they range from the solidly Democratic first district in the metro Denver area to the largely rural fourth district.
The graphic below shows the distributions Democratic support within voters' neighborhoods. The distributions reveal a fair amount about the politics of each district. Overall, we can see that the four districts currently represented by Democrats (1, 2, 6 and 7) are have higher concentrations of heavily Democratic areas than is true of concentrations of Republican voters in the Republican held districts.
Vote distributions within each Colorado Congressional District, 2024
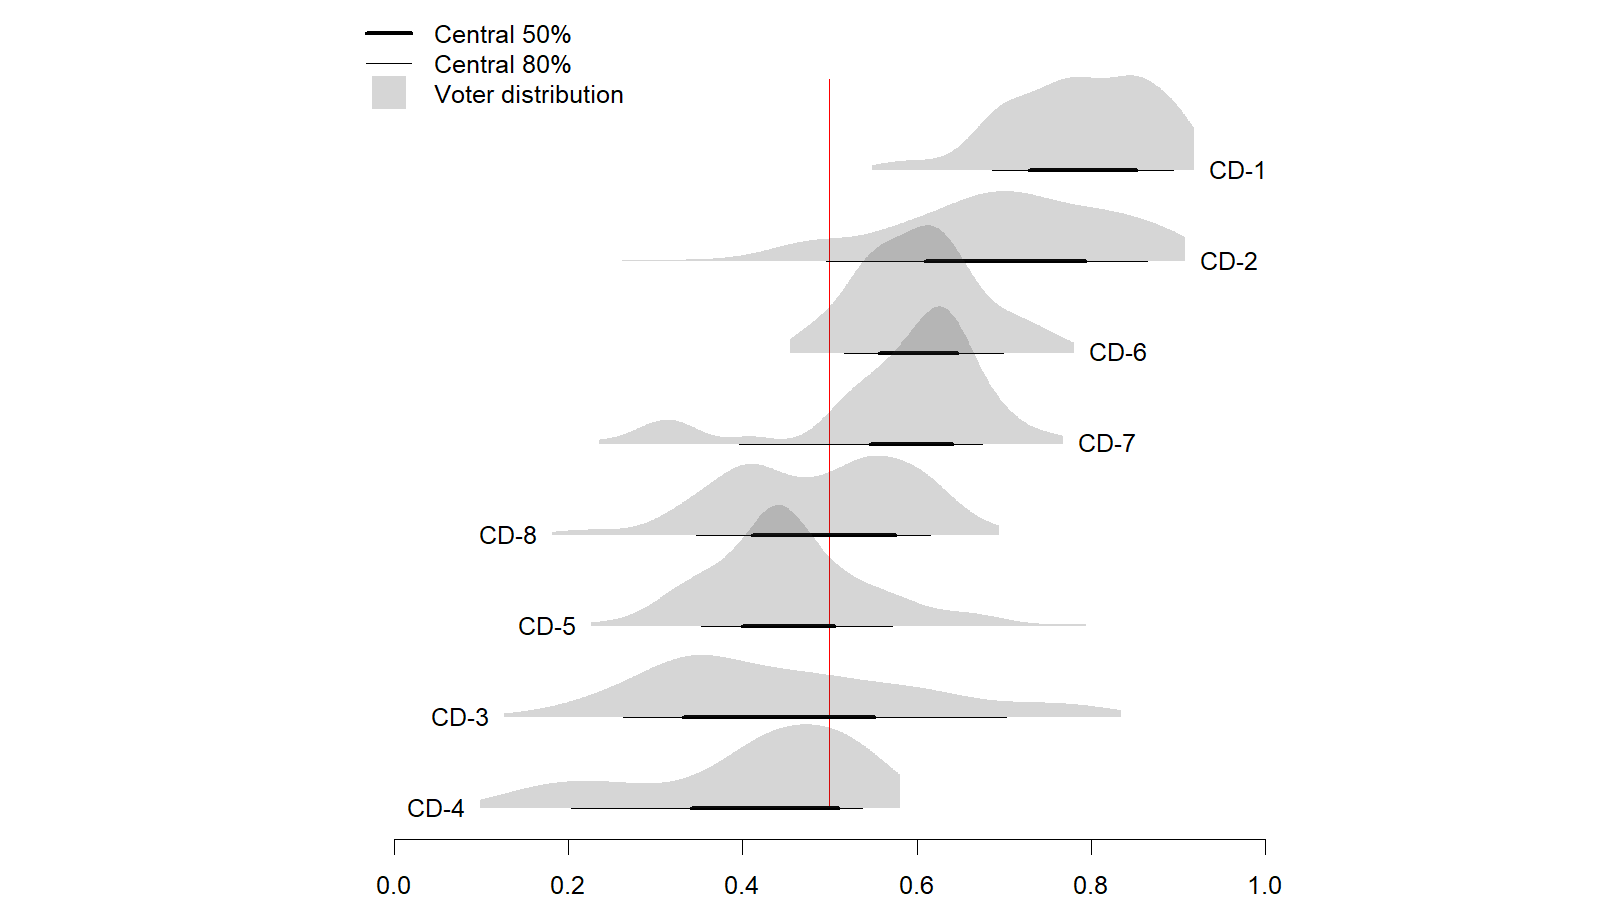
In every Republican held district in the state the central 50% (shown by the thicker black lines at the base of each distribution) of neighborhoods in those districts includes some that supported Harris over Trump. Looking at the central-most parts of the distributions for the Democratically controlled districts, none of them include neighborhoods that supported Trump over Harris.
In the fact sheets linked below, I focus mostly on four factors: Democratic vote share in the 2024 election, the share of people in a neighborhood who have a college degree or more education, the share of people who are non-Hispanic White and the degree of development in the area. The graphic below shows a scatter plot matrix showing how these different factors interrelate at the district level.
Scatterplot matrix showing the interrelationship between several different factors
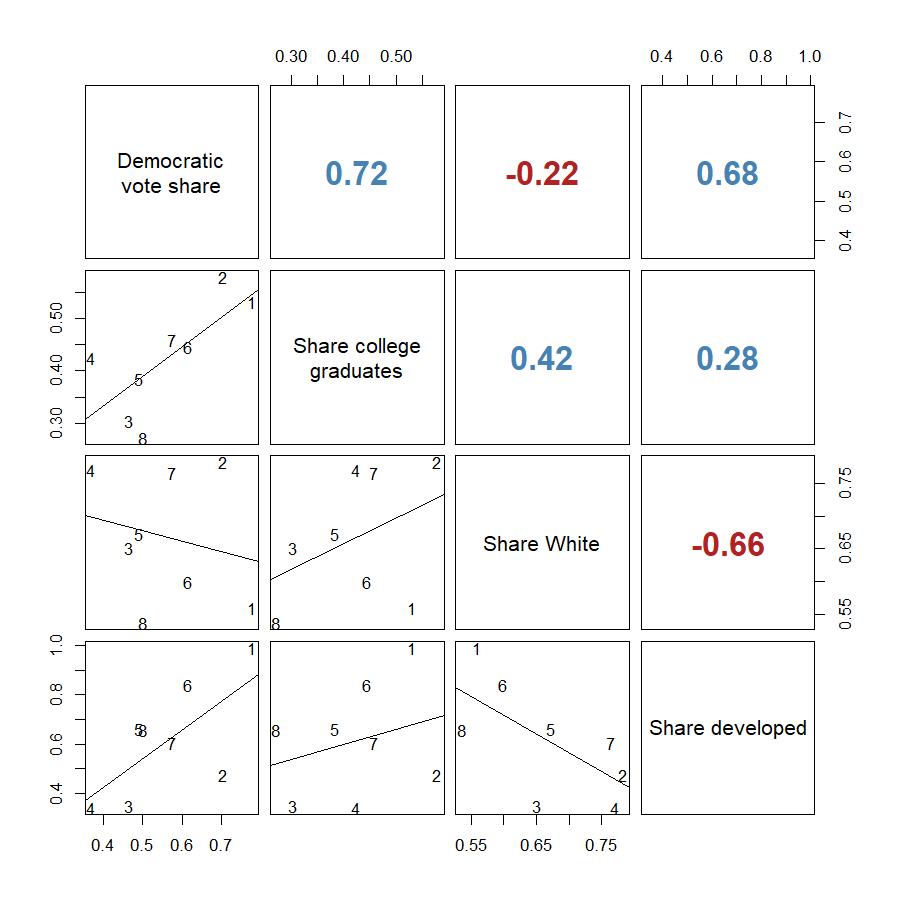
The lower left hand parts of the graphic show the scatter plots demonstrating how each variable relates to the others. For example, the plot in the first column and bottom row shows how the share of a district's land area that is developed relates to the Democratic vote in that district. We can see a strong positive relationship with the most developed districts voting most reliably for Harris in the 2024 election. The upper right hand parts of the graphic show the Pearson's correlation coefficient (which ranges from -1 to 1) and is a measure of the strength of the (linear) association between the two factors. Looking at the first row, fourth column, we can see that the correlation between the share of a district that is developed and the Democratic vote share in that district is 0.68 (a fairly strong relationship).