Colorado’s 8th Congressional District: Fact Sheet

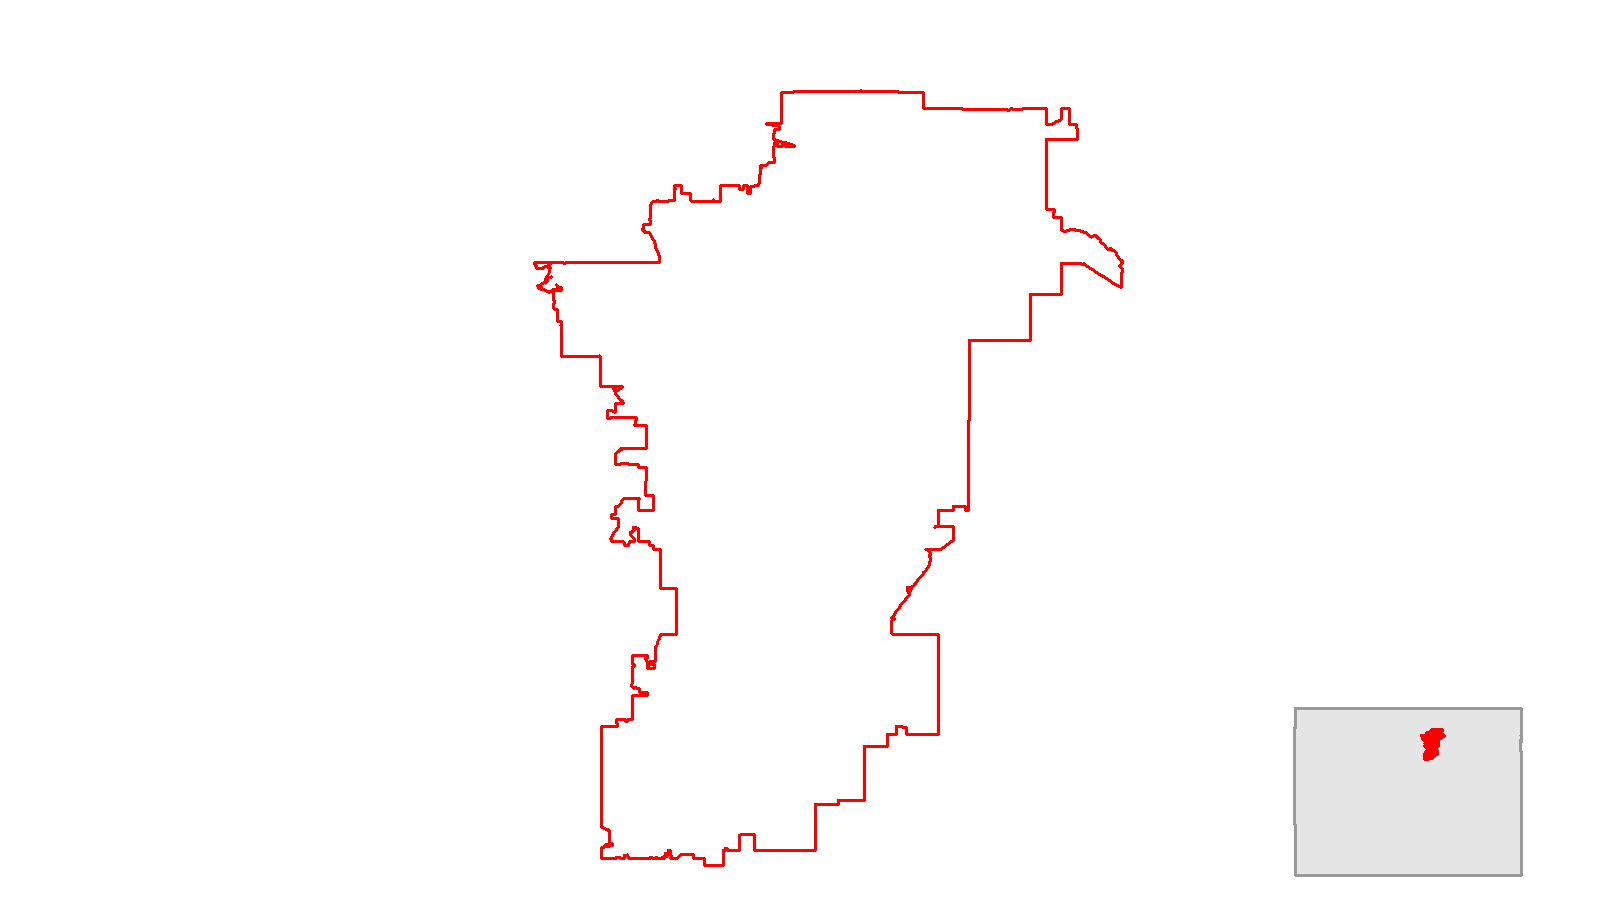
Colorado’s eighth district is located in the north central part of the state. It includes many front range communities and the northernmost part of the Denver metro area. The district was created newly as a result of reapportionment following the 2020 Census, and it is currently represented by Gabe Evans who has served since 2025.
Demographics
Population growth, 1990-2022
The population of the eighth district grew on pace with the rest of the state until the 2000s when it began growing faster than the statewide average. The population of the area now covered by the eighth district has more than doubled since 1990.
Share of the population that is White (non-Hispanic), 1990-2022
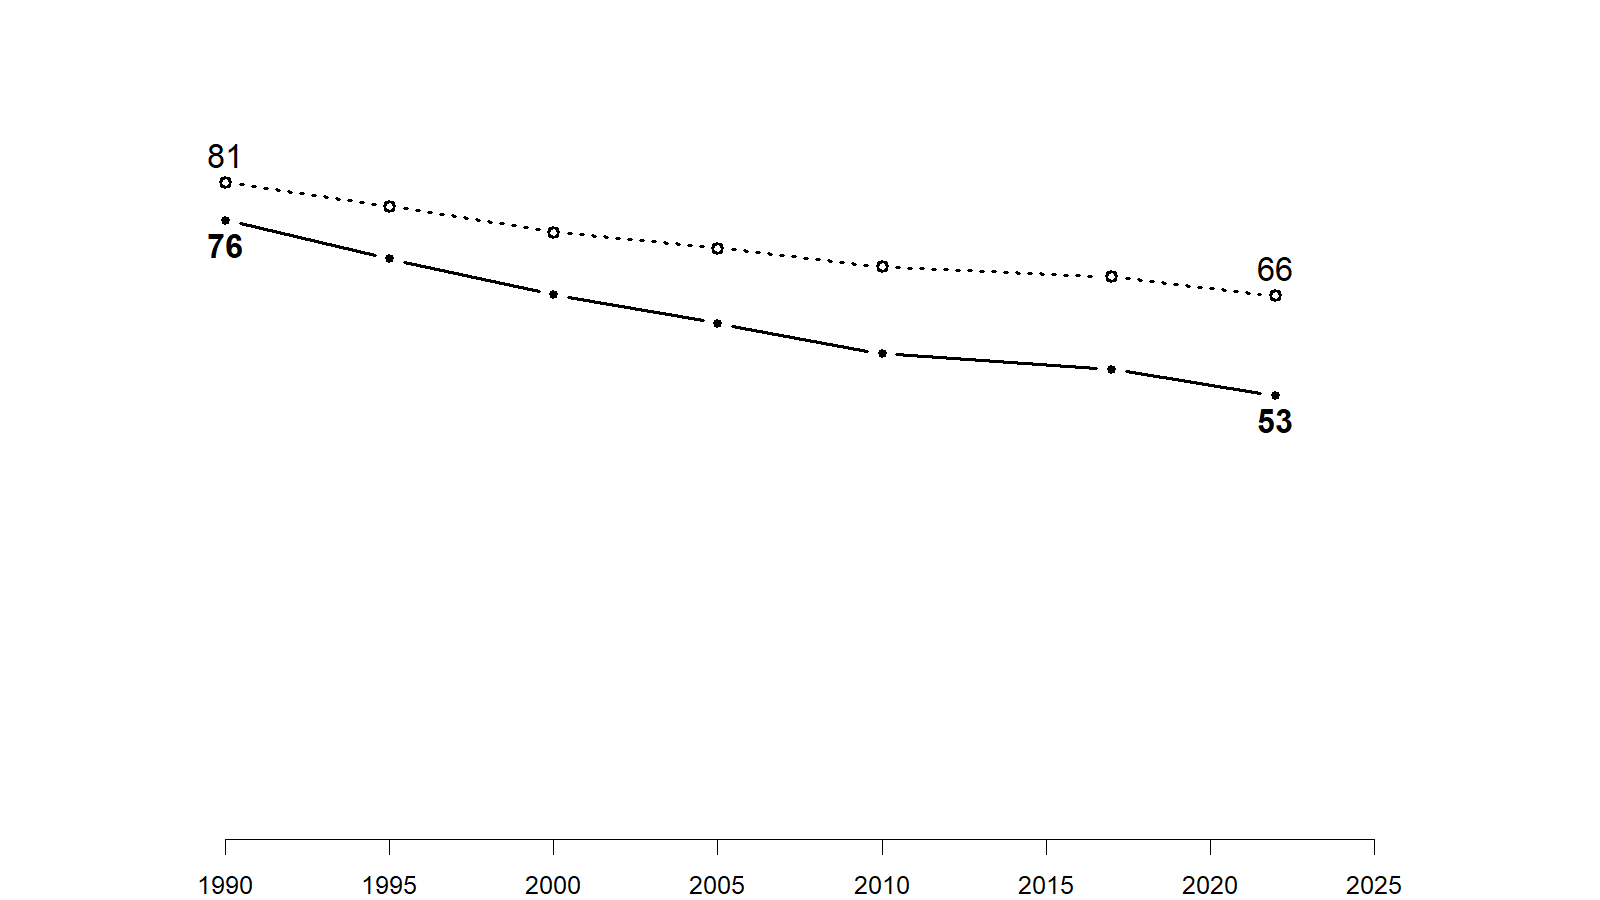
In 1990, the population of the eighth district significantly more diverse than the rest of the state. Moreover, the population living in the area covered by the district has diversified faster than the rest of the state.
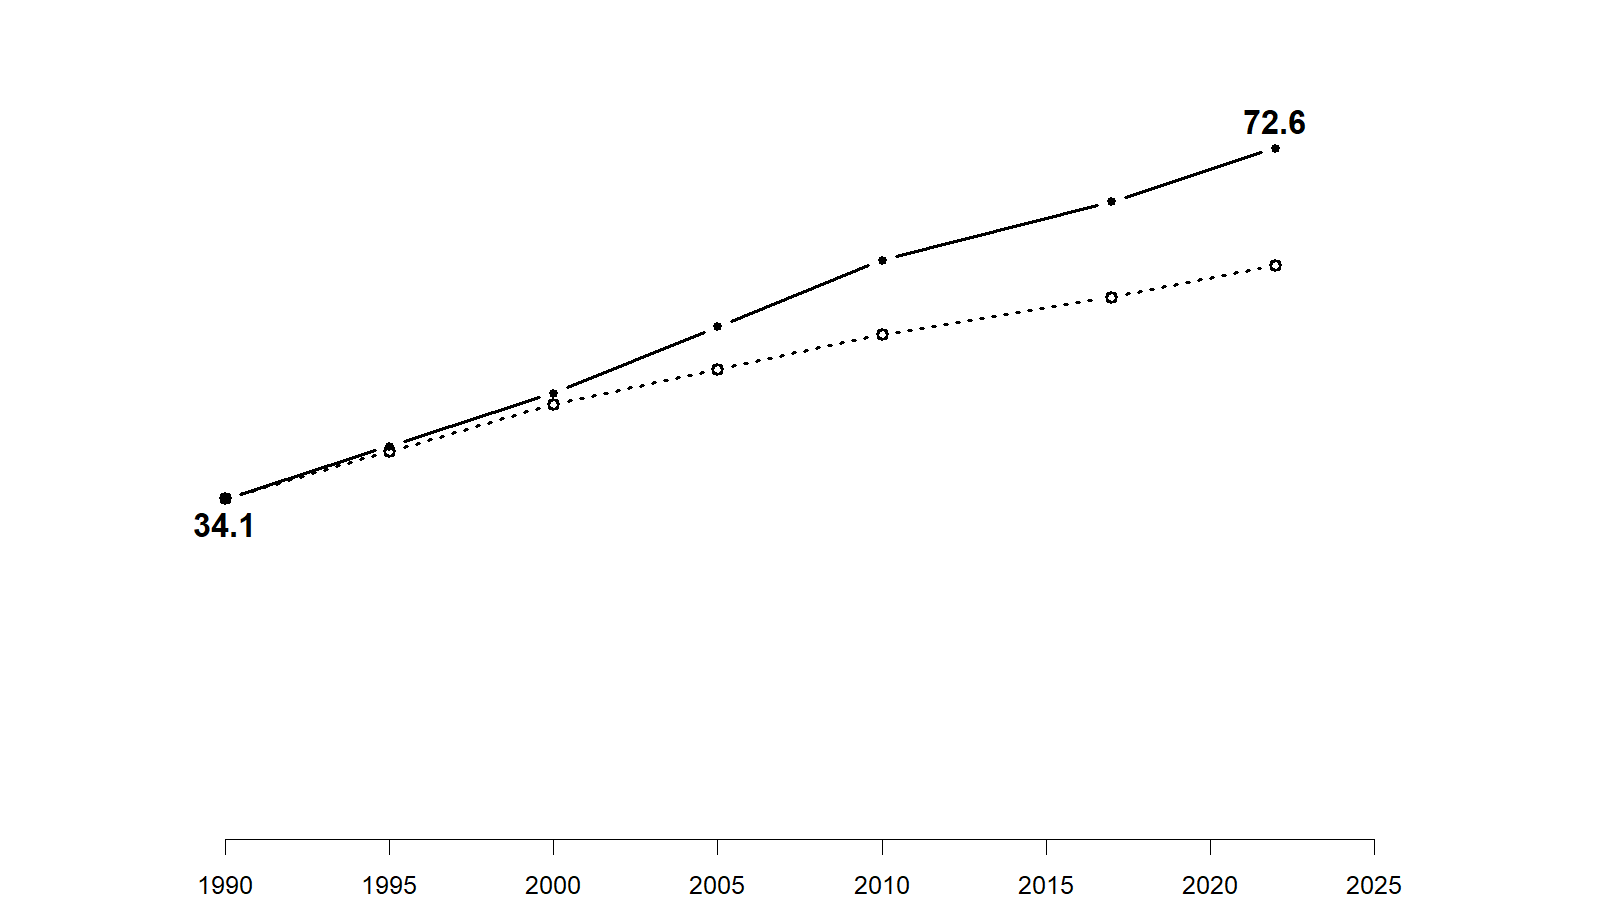
Share of the population that is Hispanic (of any race), 1990-2022
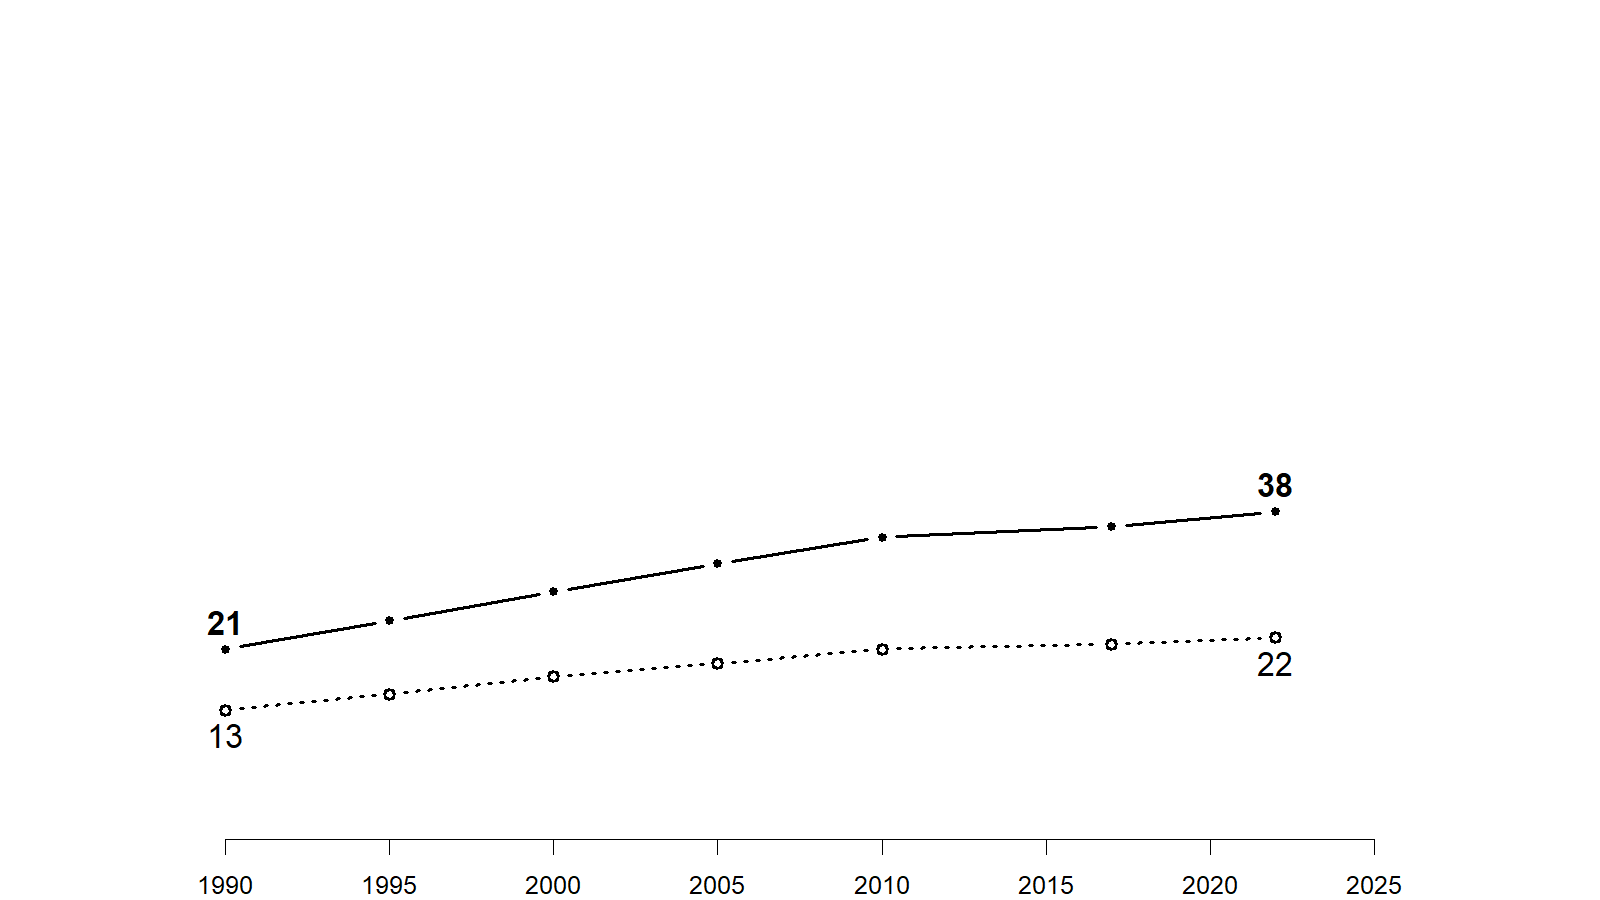
For the past 35 years, the eighth district has been home to the greatest share of Hispanic Coloradoans compared to any other district in the state. Today, the district is nearly 40% Hispanic.
Share of the population with a college degree, 1990-2022
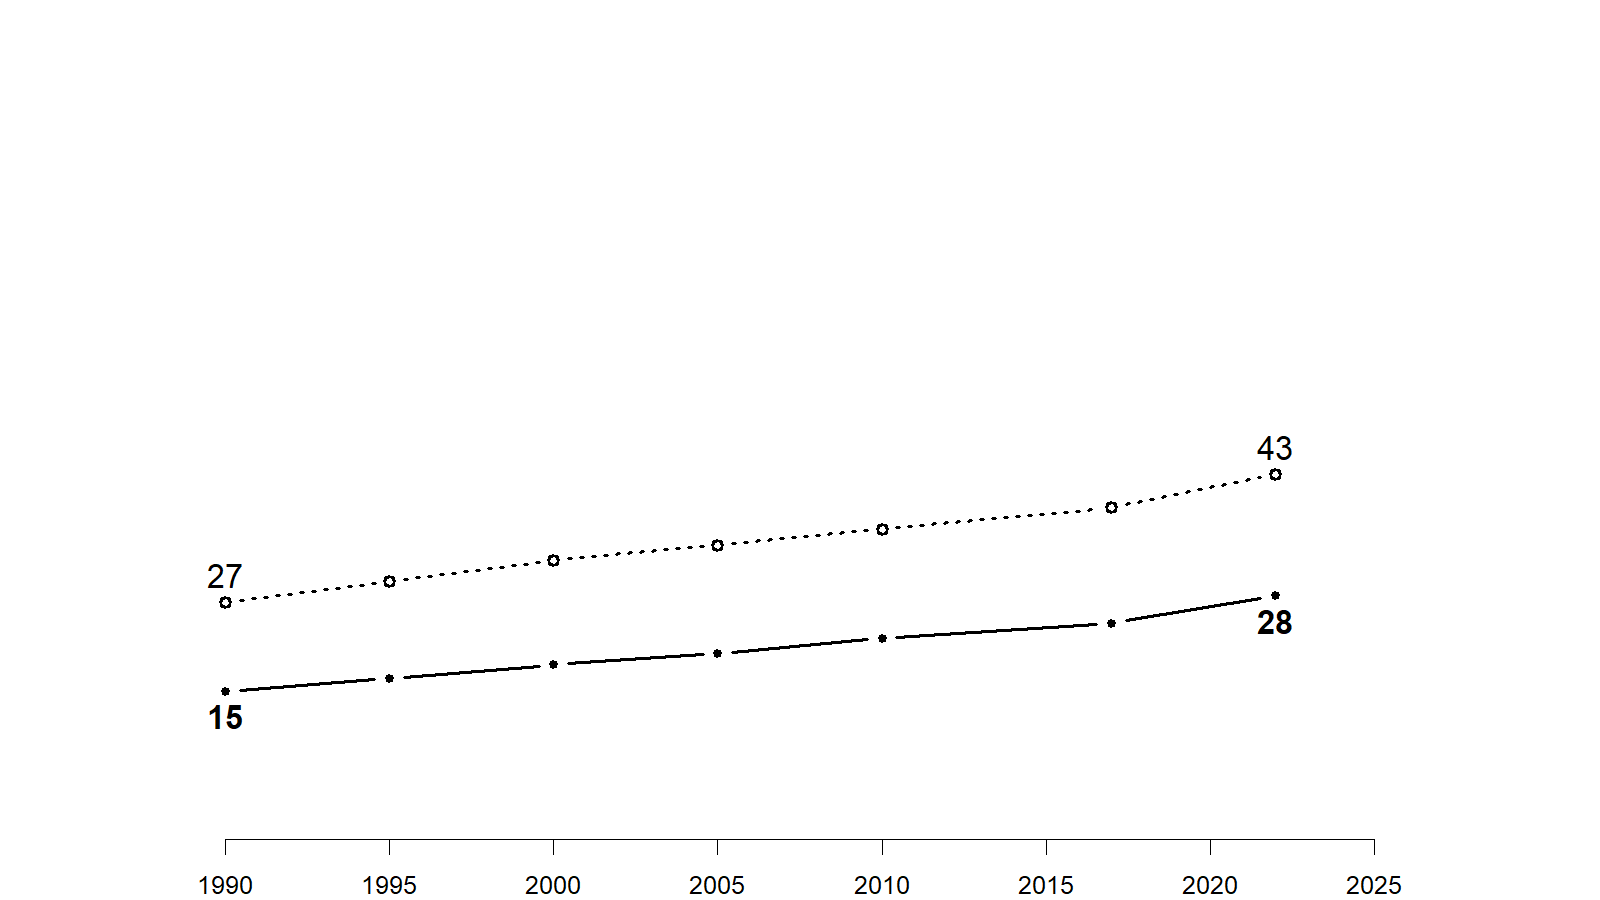
The population living in the area covered by the eighth district has substantially fewer college grads compared to other places in the state. The gap between the eighth district and the rest of the state has remained about constant over the past 35 years.
Development
Land cover, 1985-2024
In 1985, more than 60 percent of the land area in the eighth district was cultivated in some way. Today that share has dropped nearly 20 percentage points. The developed area in this district has more than doubled since 1985.
Politics
The eighth district the most evenly divided district in the state. In the 2024 election, Harris received just under 48% of the vote while Trump received just over 49% of the vote in the district. With the exception of parts of Greeley in the northern part of the district, the political division in the district is mostly north-south -- Democratic strength is primarily located in the south of the district, and Republicans are more concentrated in the northern parts.
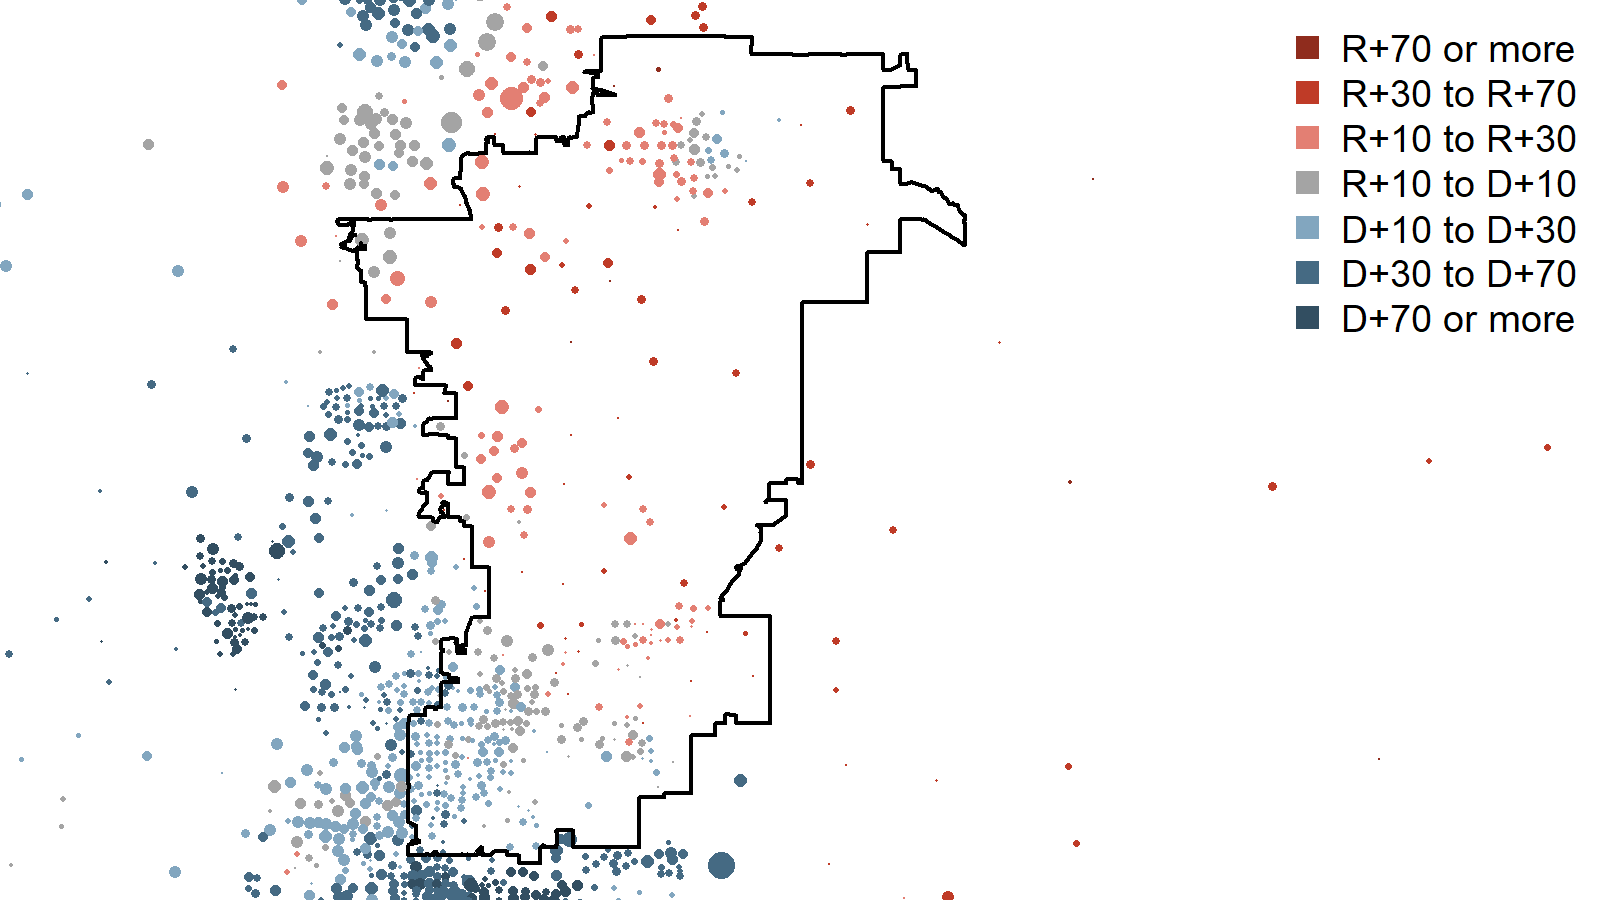
The relationship between racial and ethnic composition and 2024 Democratic vote
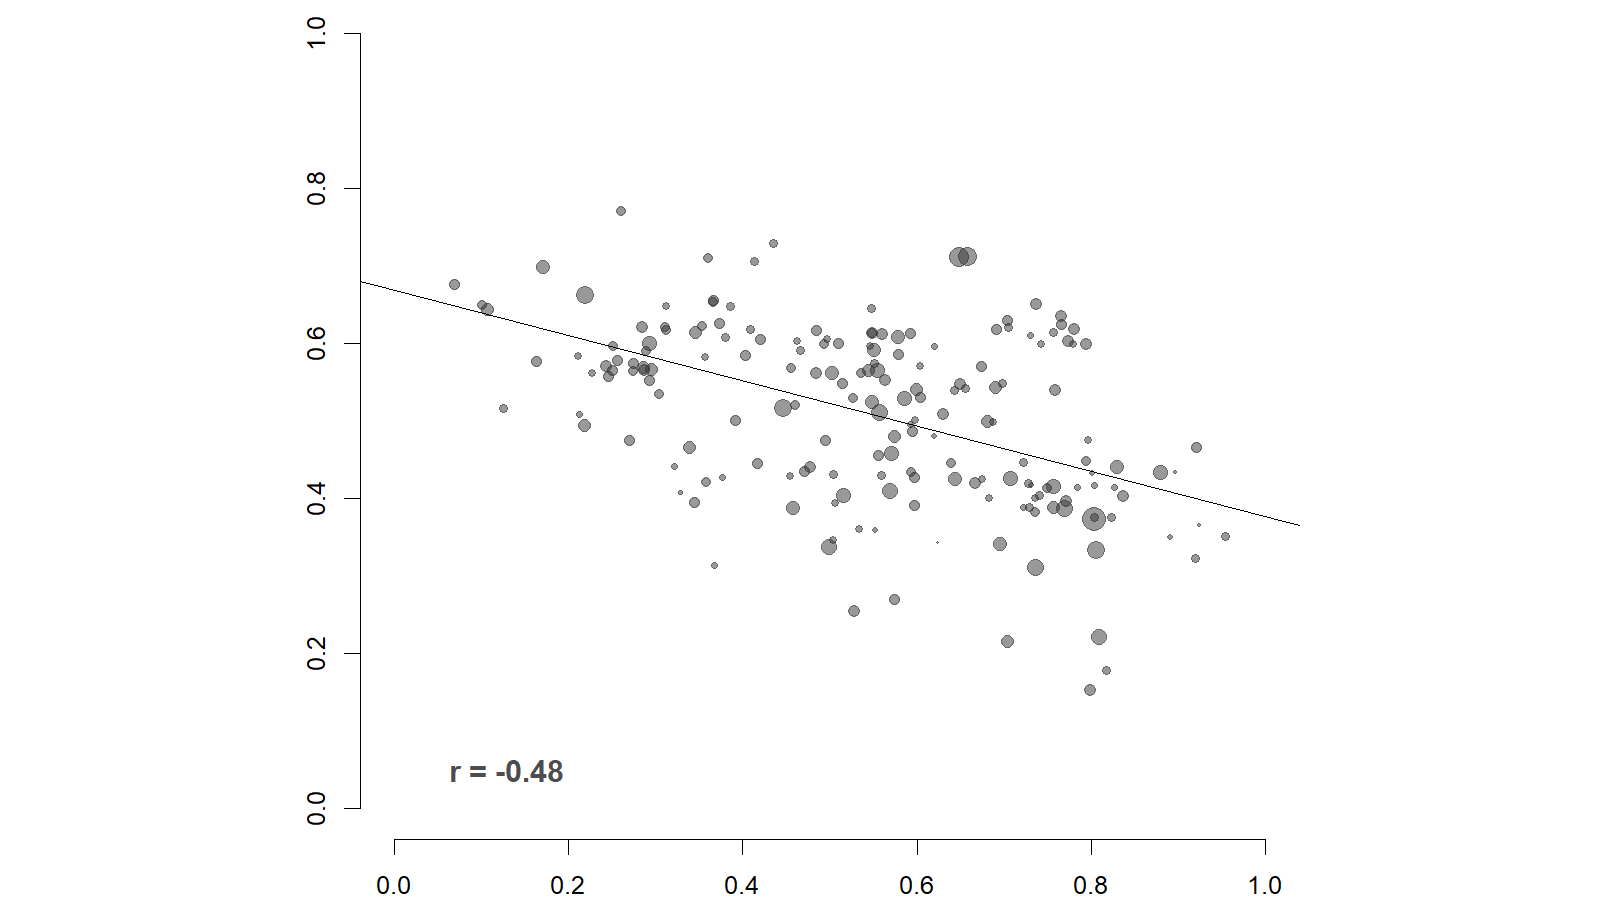
Within the eighth district, there is a fairly strong relationship between the racial and ethnic composition of places within it and the politics of those places. In general, the most Republican areas of the district have the highest shares of White residents.
Click here for a listing of fact sheets for the other districts in the state.