Colorado mid-cycle redistricting


The Trump administration's pressure on Republican-led states for mid-cycle redistricting plans that advantage the GOP has opened the debate within Colorado about the possibility of responding in kind. This post will explore what a 2027 redistricting effort – should it pass – might realistically accomplish in Colorado.
While the social sciences are not often associated with scientific innovations, the quantitative study of political districting is at least one area where political scientists have made significant contributions. The key insight from political scientists such as Gary King and Jonathan Rodden is a way to rigorously think about the possibility space in redistricting through simulations. By simulating thousands of possible districting plans, we can see the distribution of possible outcomes and where the plans that are enacted fall within those distributions.
About the data in this post
In order to construct the simulated districting plans, I rely on geographic and population projection data from the Redistricting Data Hub (an advocacy group that works against gerrymandering efforts). The simulations are built with the redist package in R using a sequential Monte Carlo method that has been shown to perform well for this purpose.
Districting proposals for the House of Representatives must be of equal population and comply with federal law (notably the Voting Rights Act). In Colorado, the independent redistricting commission places additional constraints. Plans should favor compact districts and those that do not split existing political entities where possible (e.g. municipalities, counties). Additionally, Colorado law explicitly bans plans that are drawn with the explicit intention to favor or disfavor a specific political party.
Colorado's most recent districting plan enacted after the 2020 national census left the state with eight districts for the House of Representatives: four Democratic-leaning districts, three Republican-leaning districts, and one (the eighth) that is about evenly split between the two major parties. The eighth district was also designed to provide representation for the Hispanic community in the area (per the VRA).
In this post, I'll consider two possible scenarios for mid-cycle redistricting:
- Plans that closely mirror the constraints that the independent commissions are supposed to apply
- Plans that are constrained only to create geographically contiguous districts (not actually a requirement of federal law, but all extant congressional districts technically meet this criterion [though some states have gotten creative about staying technically within this limit while violating the spirit of it])
Simulation results
The graphics below show the distribution of partisan outcomes of two different simulations (each simulation includes 10,000 hypothetical redistricting plans). We can look at the distribution of outcomes in these simulated congressional district plans to understand what the range of possibilities in mid-cycle districting might be.
Political outcomes
We can calculate the political leanings of a districting plan by looking at the shares of voters in those areas who supported either Harris or Trump in 2024. Past presidential election outcomes are highly correlated with future congressional votes, but the relationship isn't perfect. Midterm election years have substantially lower turnout compared to presidential years, and the demographics of the electorate vary systematically as well. Incumbency advantages and other idiosyncratic factors of a particular race will also have their own effects, but the presidential vote gives us a general sense of the political complexion of a place.
The graphics below show the shares of simulations that had a given number of Democratic, Republican, and swing districts. The first row of bars in each graphic show the results from the constrained districting plan (which tried to minimize county splits, create compact districts, and preserve a district with a plurality of Hispanic constituents). The second row of bars shows the results with no constraints.
Democratic-leaning seats from redistricting simulations ...
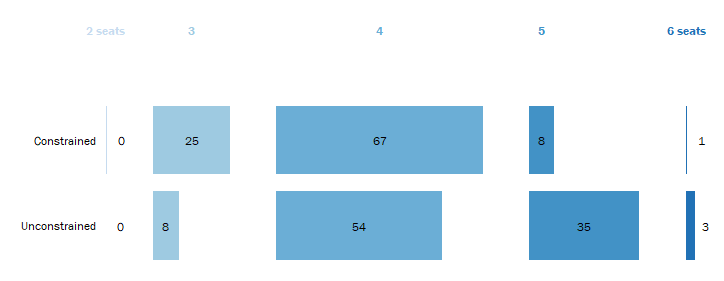
In two-thirds of the constrained simulations, Colorado ended up with four leaning Democratic districts (much like the status quo). A quarter of these simulations left Colorado with fewer Democratic-leaning seats and just under 10% produced five or (in the case of just 59 out of 10,000 simulations) six Democratic-leaning seats.
The unconstrained simulations showed substantially more Democratic seats on average. The modal outcome (54% of simulations) was still four Democratic seats, but nearly 40% of the simulations resulted in five or six Democratic-leaning seats.
Republican-leaning seats from redistricting simulations ...
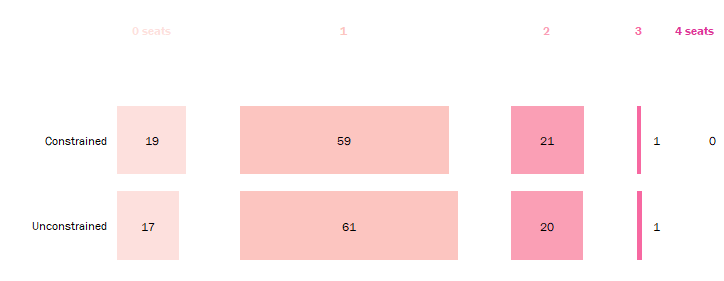
The impact of the simulation conditions on the number of Republican-leaning seats was much less pronounced. In both conditions, about 60% of the time, the simulations resulted in only one solidly Republican seat. In just under 20% of the simulations, the simulations created no districts that Trump carried by more than 10 points. In slightly more than 20% of the simulated outcomes, Republicans ended up with two or three likely seats.
Swing seats from redistricting simulations ...
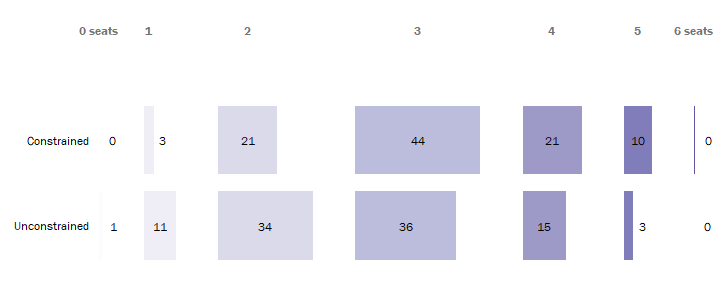
The constrained simulation created significantly more competitive seats compared to the unconstrained simulation.
Compactness
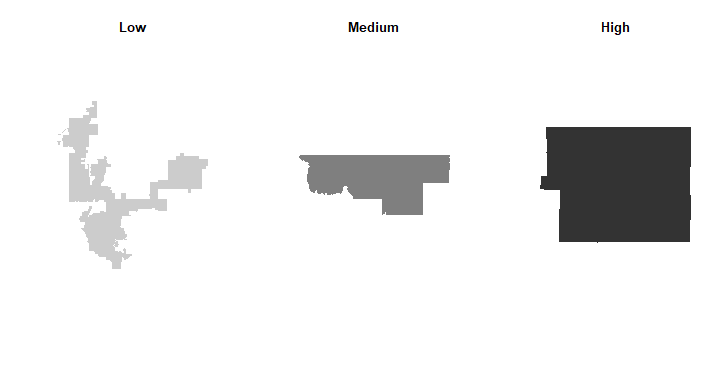
The "compactness" of a district can be measured in a variety of ways. One of the most straightforward is the Polsby-Popper score. This score compares the circumference of the district to the most compact possible version (a perfect circle). Lower scores are bigger departures from the most compact possible district. The graphic below shows three illustrative examples from the simulations to give a sense of the spread of resulting districts.
Examples of different districts by levels of compactness
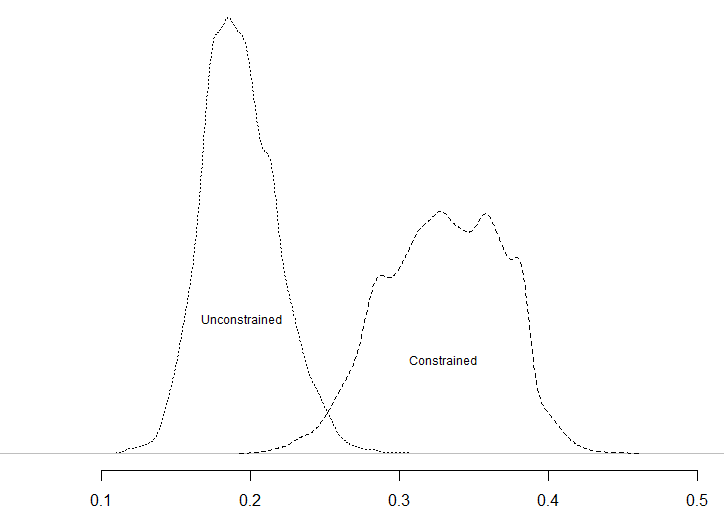
The graphic below shows the distribution of the average compactness scores for the districts in each of the simulation runs. The score ranges from near zero for the least compact districts to one (for a hypothetical district that is a perfect circle).
Impact of compactness constraint on simulation results
Concluding thoughts
There are two major takeaways from this analysis for me. First, mid-cycle redistricting is likely to produce a set of districts in Colorado that would provide Democrats with at least two more safe Democratic districts. The calculations here are based on 2024 vote, and, if the special elections that have been held since the 2024 are any guide, Democrats might be set up to perform significantly better than the 2024 baseline. If we assume a five percentage point swing, there are a few possible redistricting plans that would result in eight comfortably Democratic districts.
Secondly, the analysis here shows how the constraints placed on districting in Colorado systematically disadvantage the Democratic Party in the state. A big part of this disadvantage comes from the way that Democrats are more geographically concentrated in urban areas. The districts created under the constraints used by the independent redistricting commission produce fewer Democratic districts on average than when we simulate districts without those constraints.