Colorado’s 6th Congressional District: Fact Sheet


Colorado’s sixth district is south and east of Denver. The district contains Aurora, Littleton and Centennial. The district has been represented by Jason Crow since 2019.
Demographics
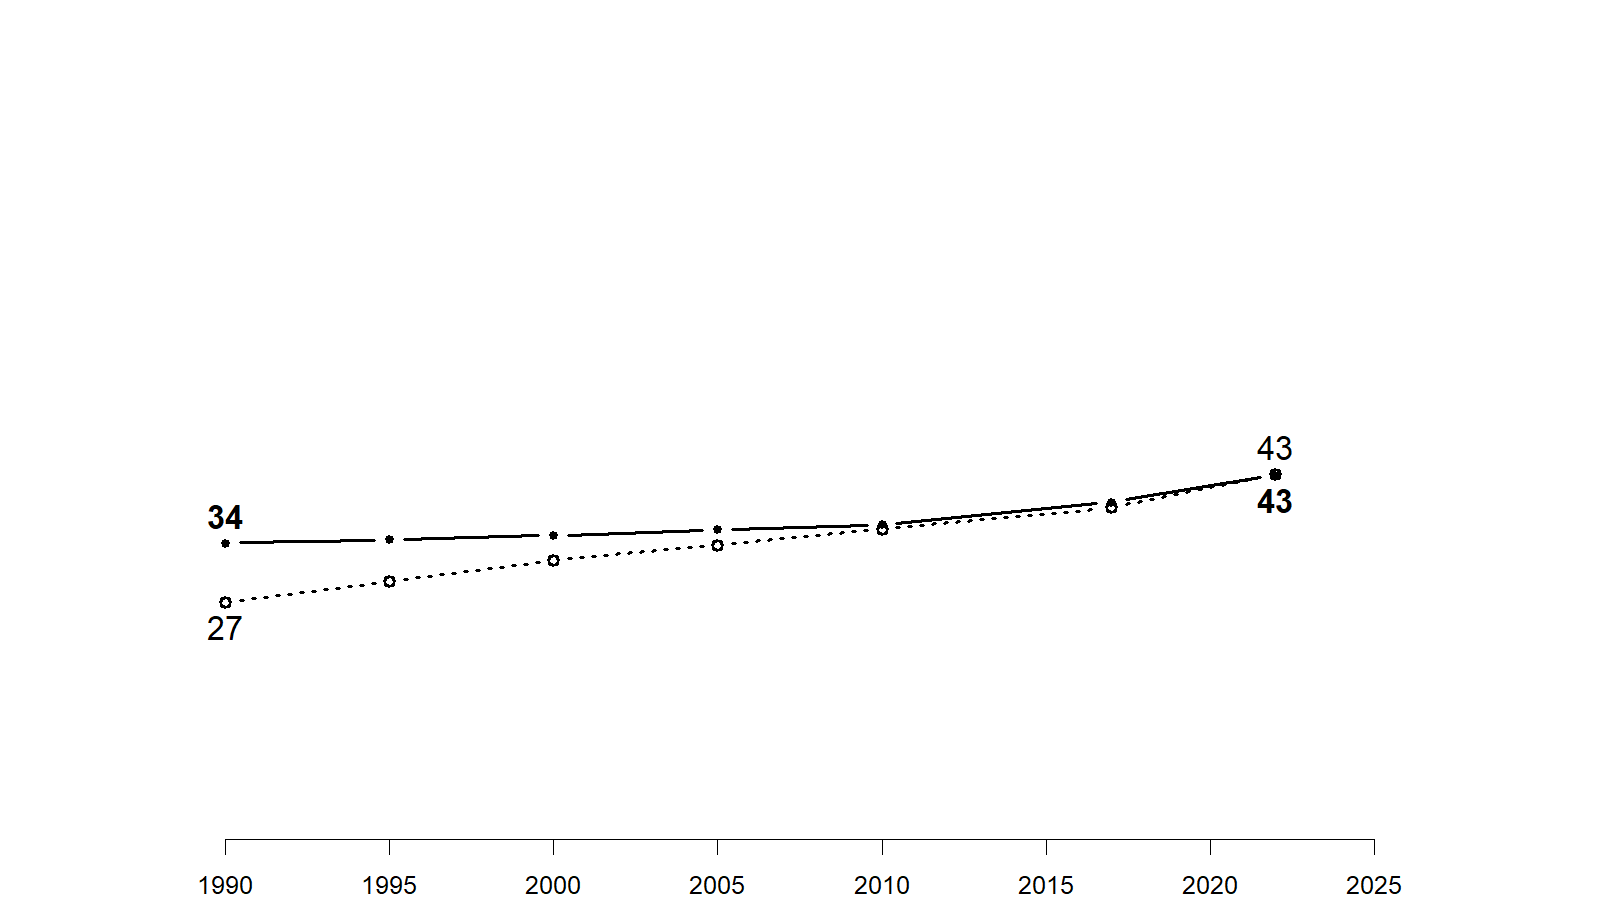
Population growth, 1990-2022
The population of the sixth district has grown at a somewhat slower pace compared with the rest of the state. Overall, the state's population has grown by 75% over the past 35 years. The population in the current sixth district boundaries has increased by about 60 percent.
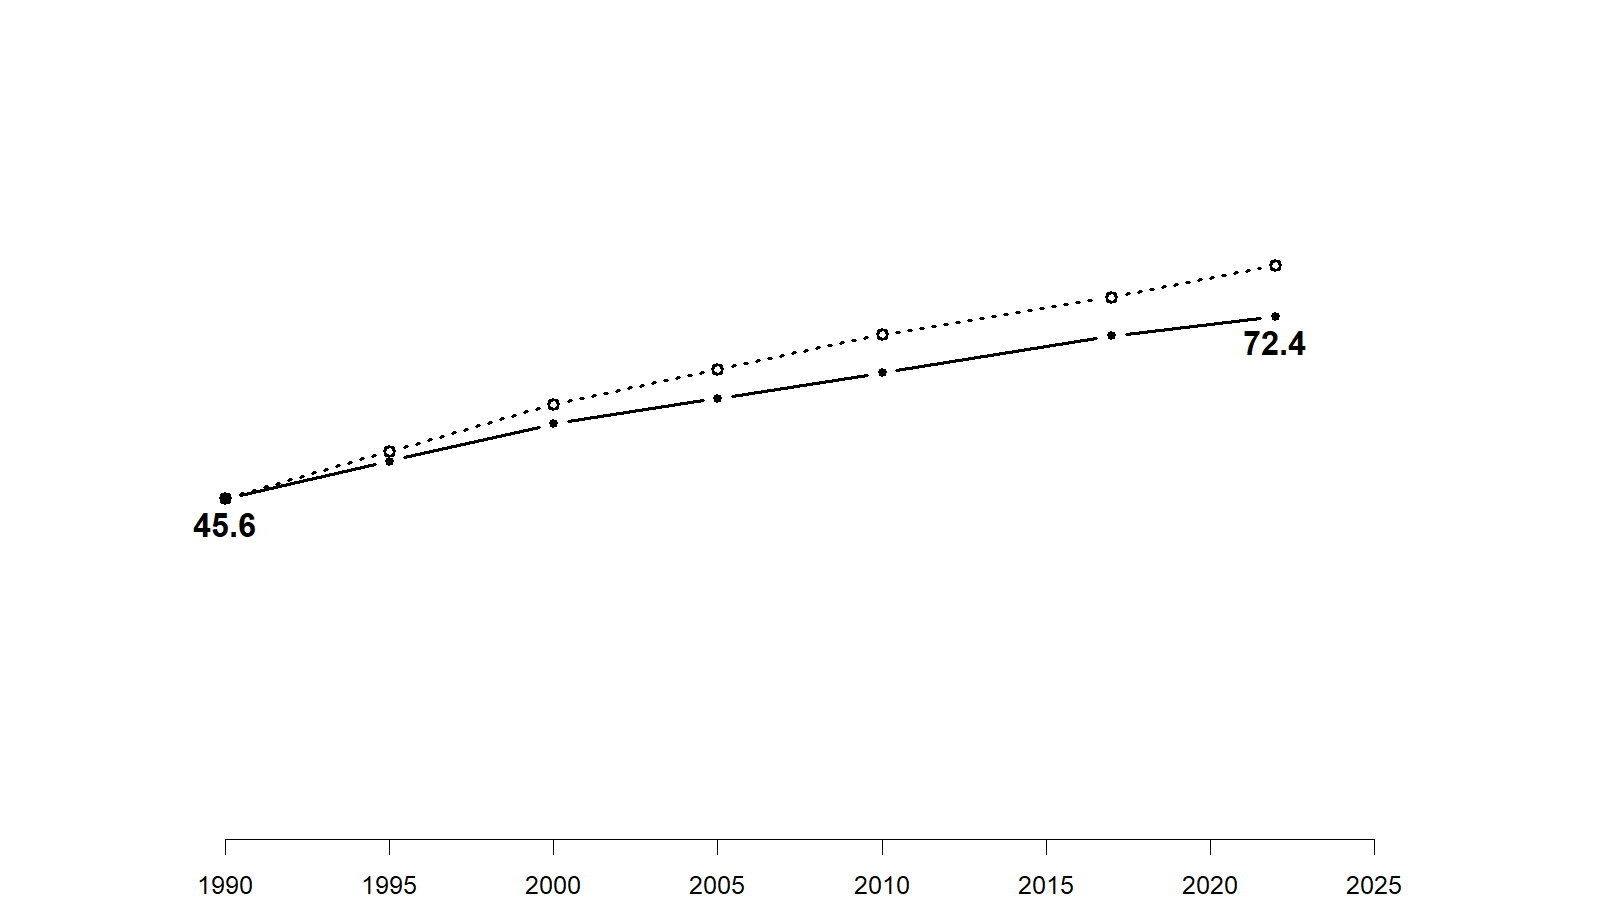
Share of the population that is White (non-Hispanic), 1990-2022
In 1990, the population of the sixth district was somewhat more White than the rest of the state. However, it has diversified at a quicker pace than the rest of the state. Today, the sixth district is about 10 percentage points less White than the state as a whole.
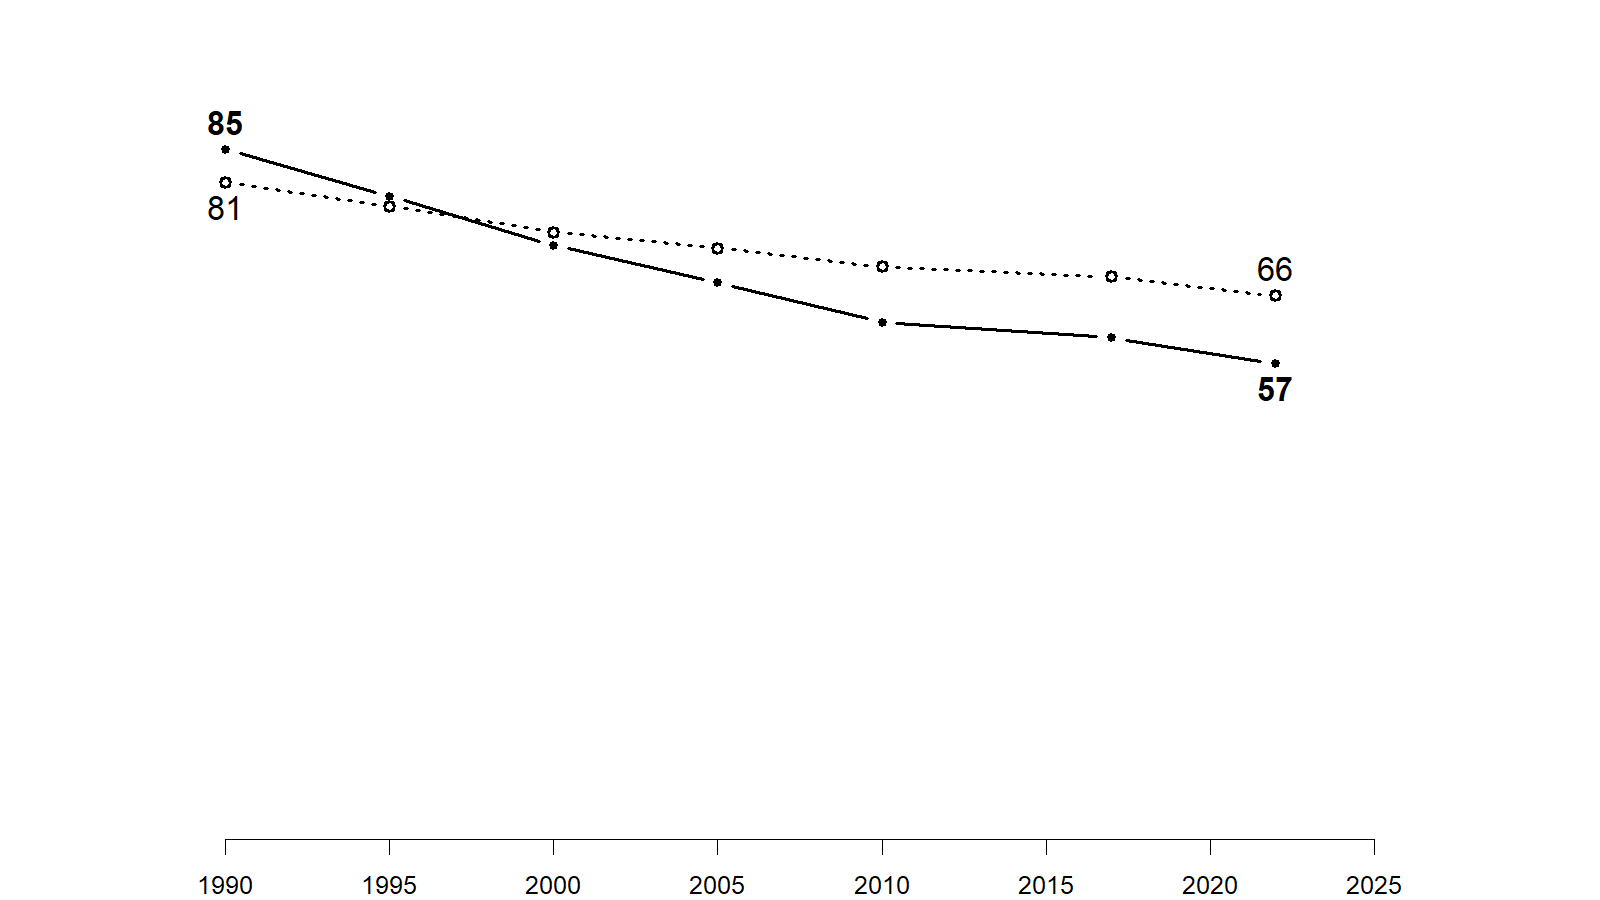
Share of the population with a college degree, 1990-2022
Thirty-five years ago, the population of the living in what is now the sixth district was substantially more likely than the statewide population to have a college degree. That share has increased somewhat since 1990, but the statewide share has increased at a quicker rate. Today the share holding a college degree in the district is about equal to the statewide share.
Development
Land cover, 1985-2024
The land area in the sixth district was already substantially developed in 1990 with about a third of the total land area being developed. Today, more than half of the area in the district has been developed.
Politics
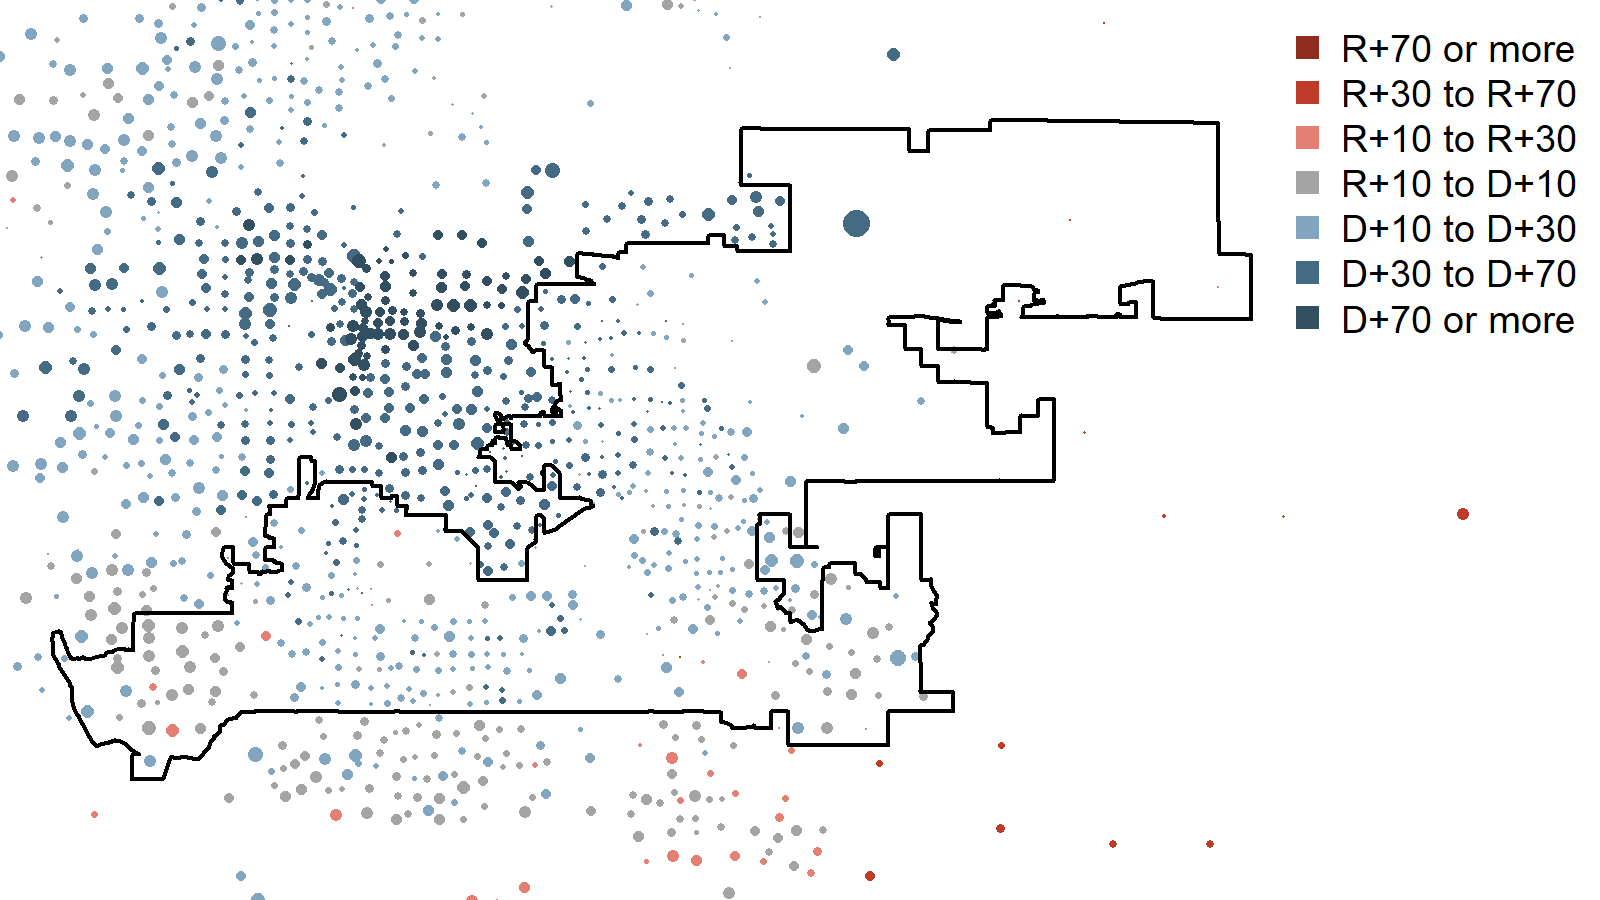
The sixth district is somewhat more Democratic in its voting patterns than the rest of the state. In the 2024 election, nearly 60 percent of voters in the district supported Harris compared to 54% support statewide.
The relationship between educational attainment and 2024 Democratic vote
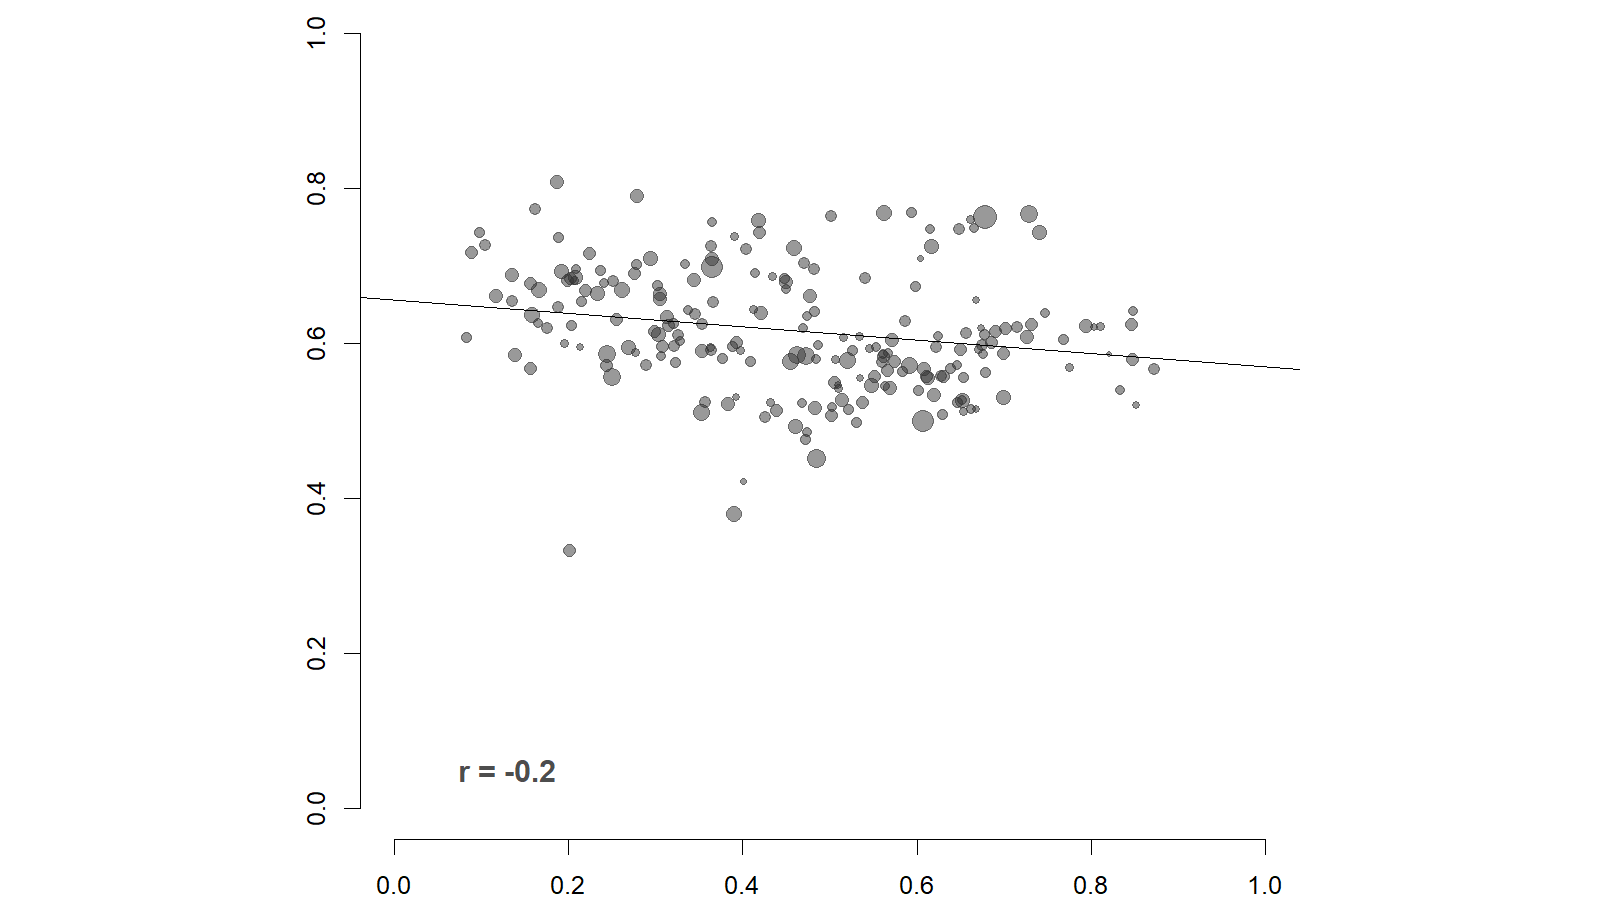
Unlike many other districts in the state, there is very little relationship between the share of a neighborhood with a college degree and Democratic vote in that area. To the extent that a relationship exists, it actually runs in the opposite direction with more highly educated areas supporting Trump over Harris on average (though as noted, the relationship is not strong).
The relationship between racial and ethnic composition and 2024 Democratic vote
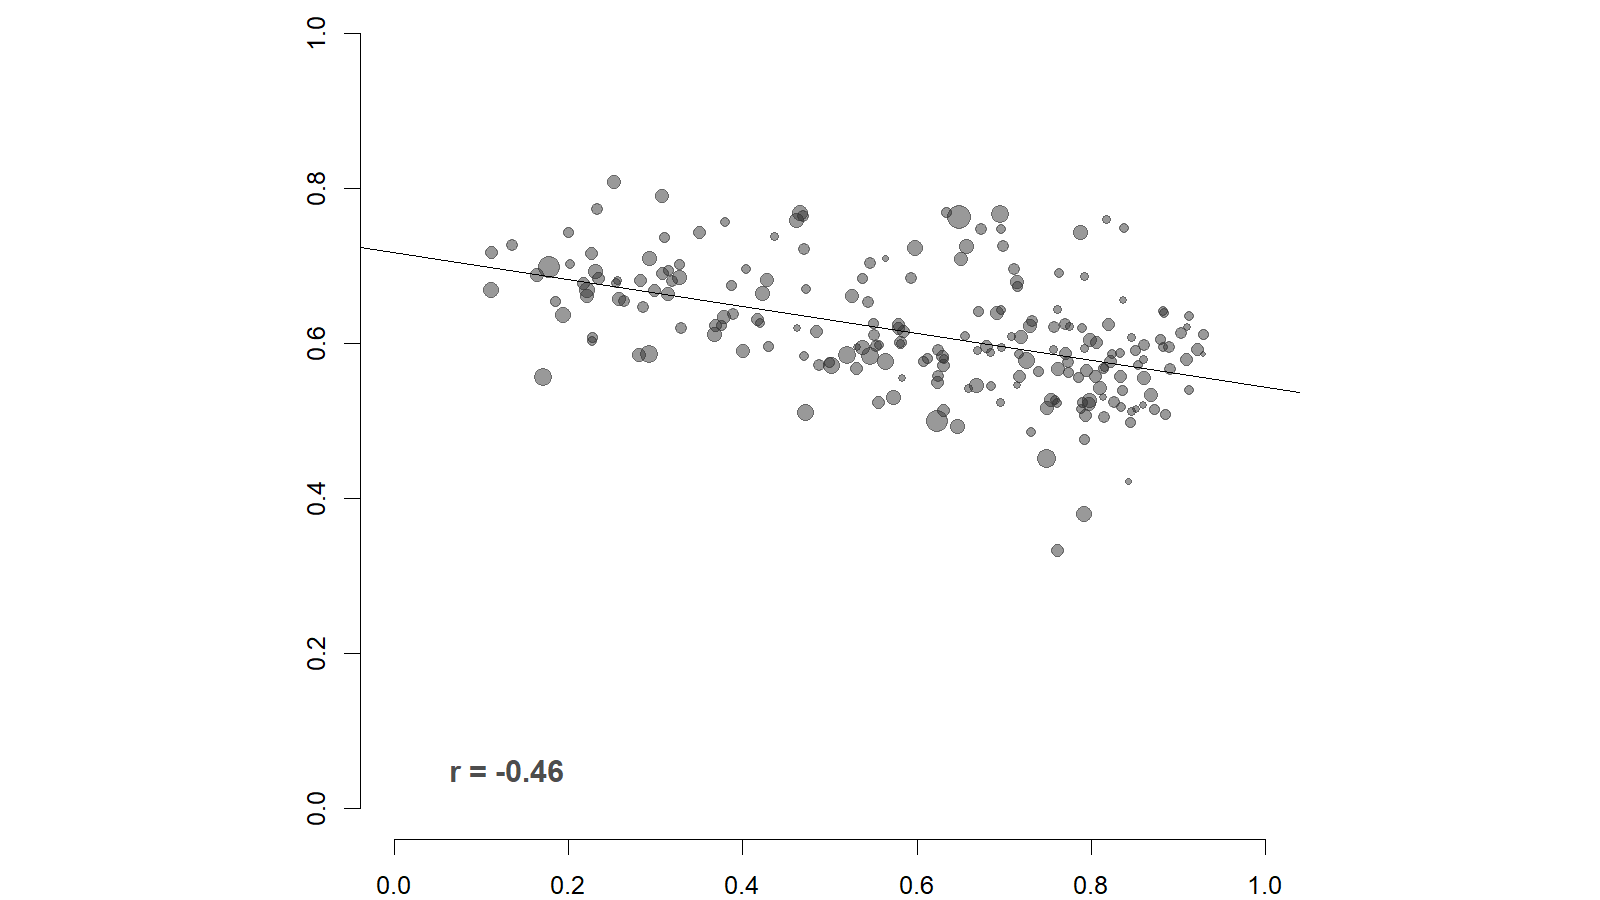
The parts of the district that had greater shares of White residents were somewhat more likely to support Trump, and the relationship between racial composition and voting patterns was stronger than the relationship with education.
Click here for a listing of fact sheets for the other districts in the state.