Colorado’s 7th Congressional District: Fact Sheet

Most of the population of the seventh district lives in the western parts of the Denver metro area. The district also includes many smaller central mountain towns. The district has been represented by Brittany Pettersen since 2023.
Demographics
Population growth, 1990-2022
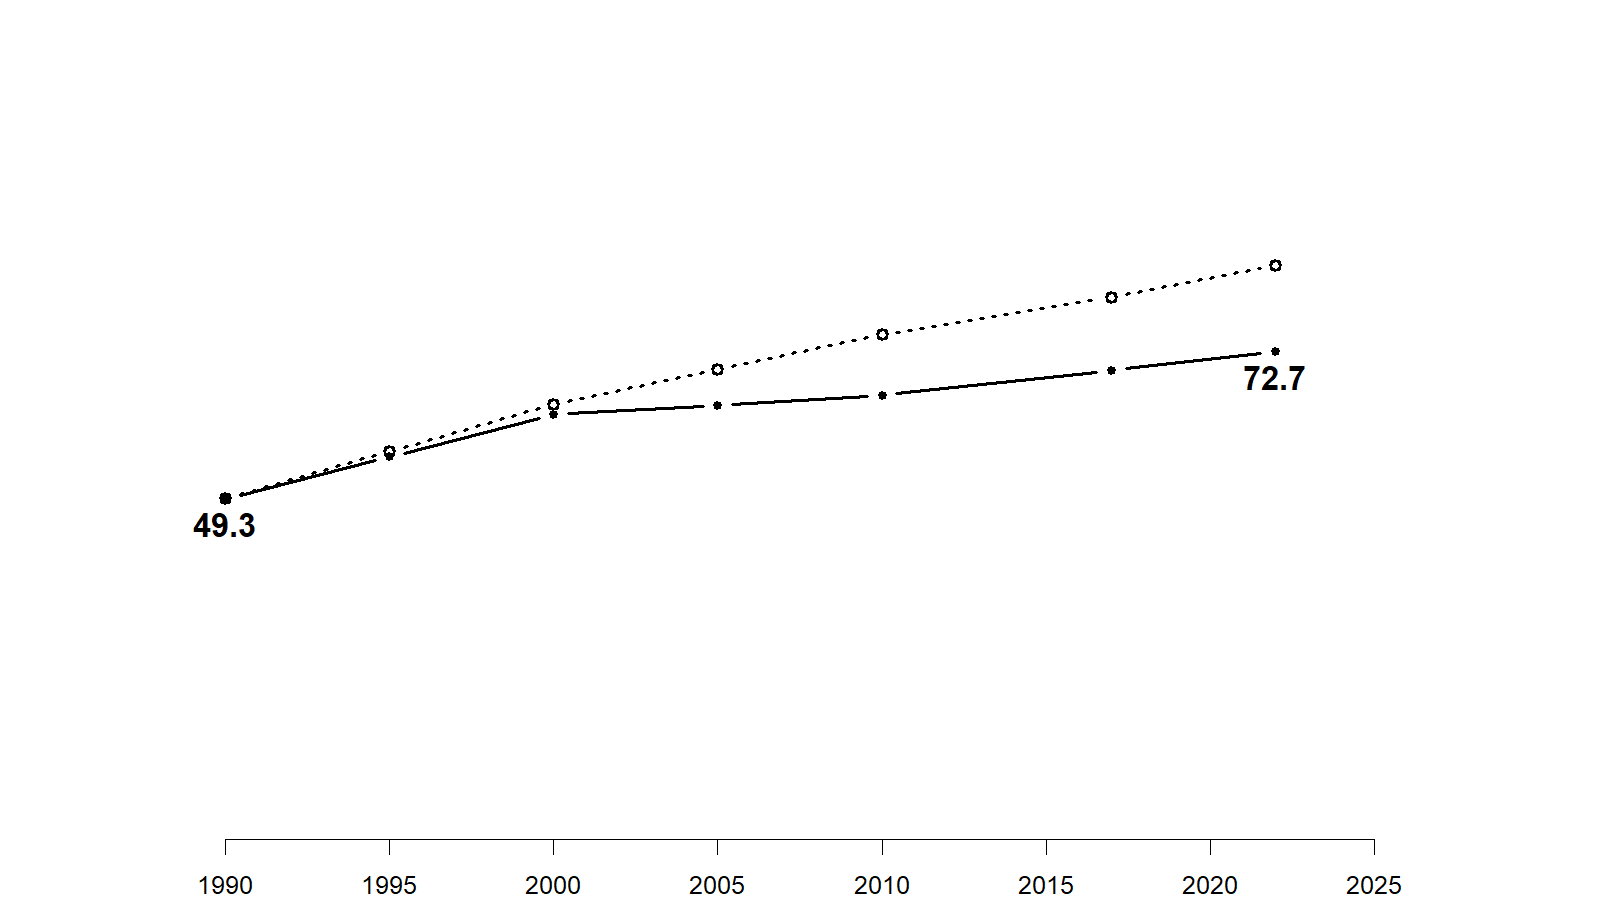
The population of the seventh district has grown at a somewhat slower pace compared with the rest of the state. Overall, the state's population has grown by 75% over the past 35 years. The population in the current seventh district boundaries has increased by just under 50 percent.
Share of the population that is White (non-Hispanic), 1990-2022
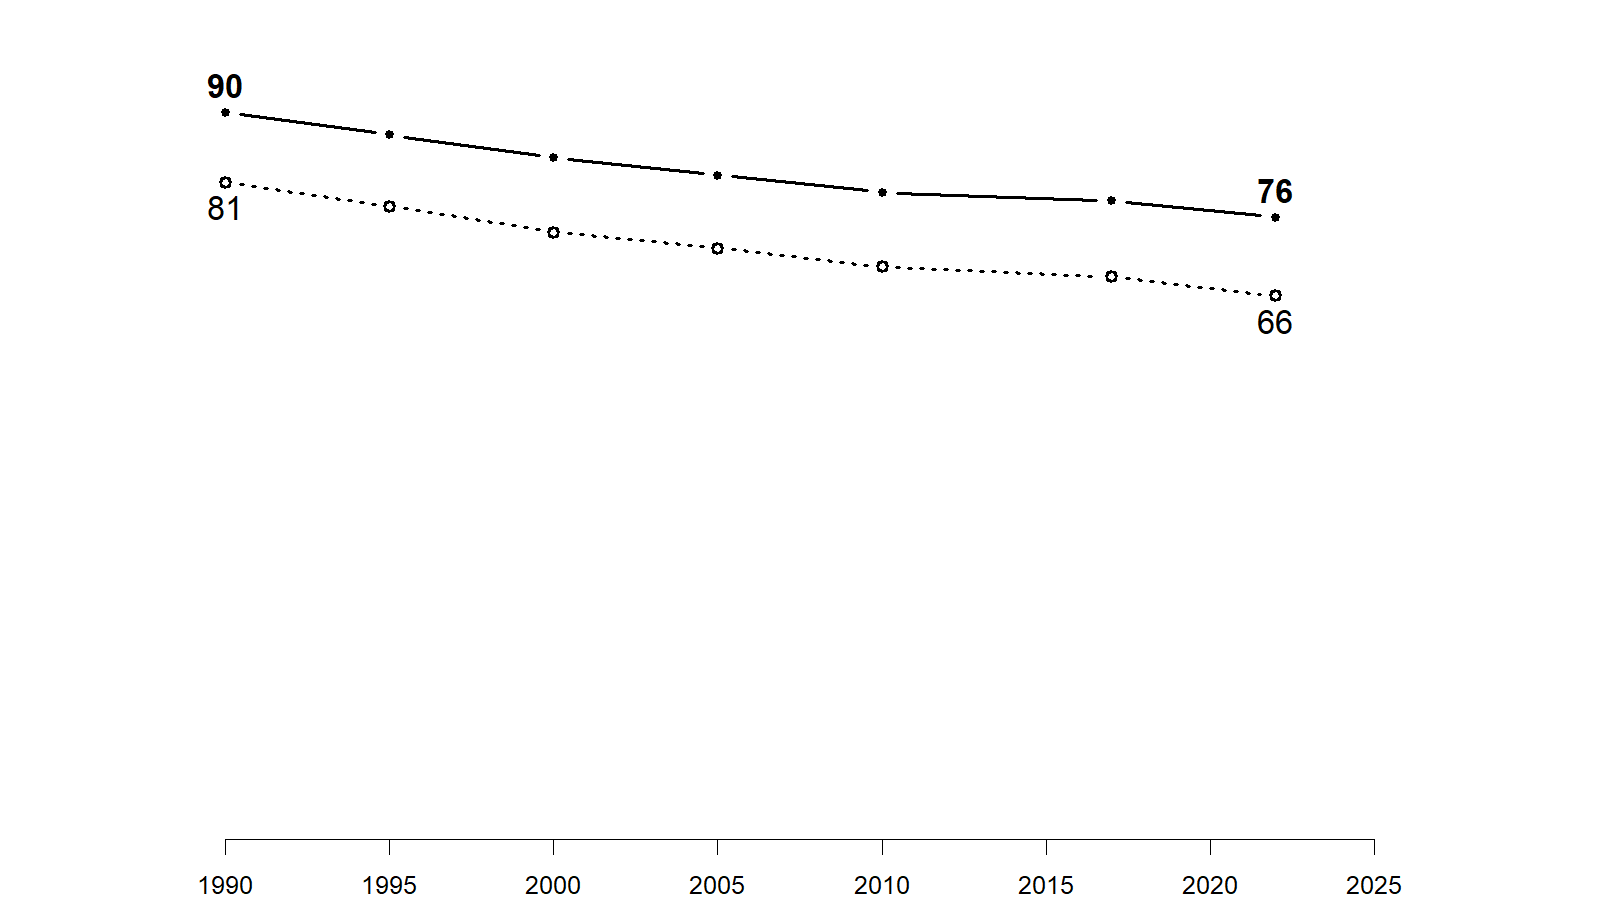
The population living in the area covered by the seventh district is substantially Whiter than the statewide trend. This gap has remained relatively constant over the past 35 years.
Share of the adult population ages 18-39, 1990-2022
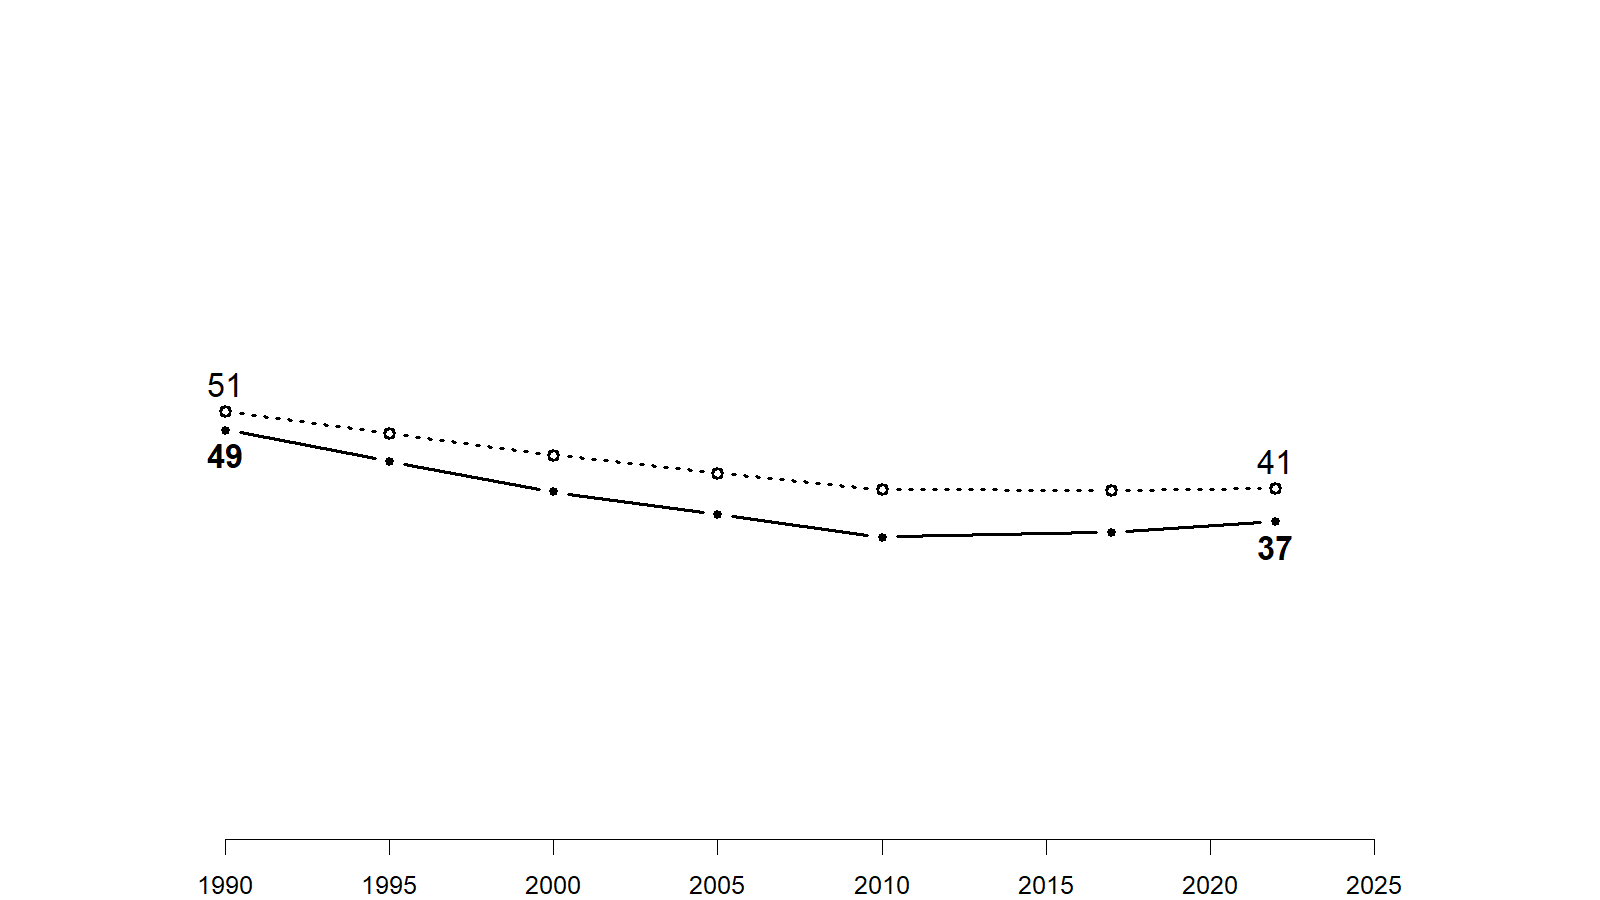
The seventh district, at least for the period under consideration here, has a somewhat older population compared with the rest of the state.
Development
Land cover, 1985-2024
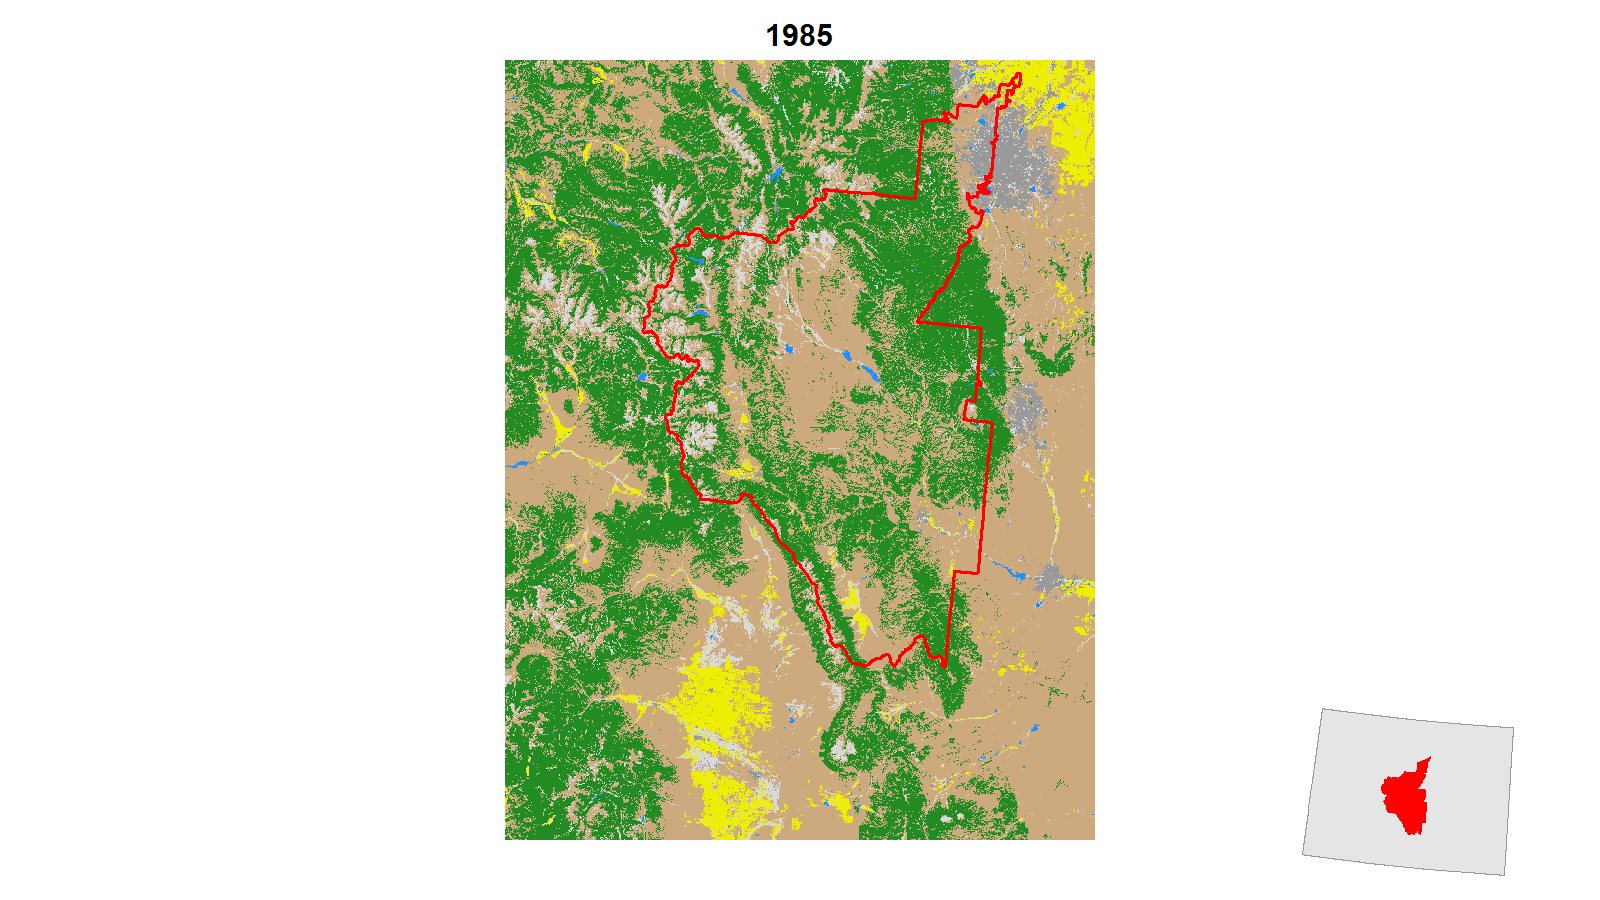
Most of the development in the area now covered by the seventh district has occurred in the Denver metro area as the cities that make up this area have pushed toward the mountains. There has also been significant development in the mountainous areas – specifically Cañon City.
Politics
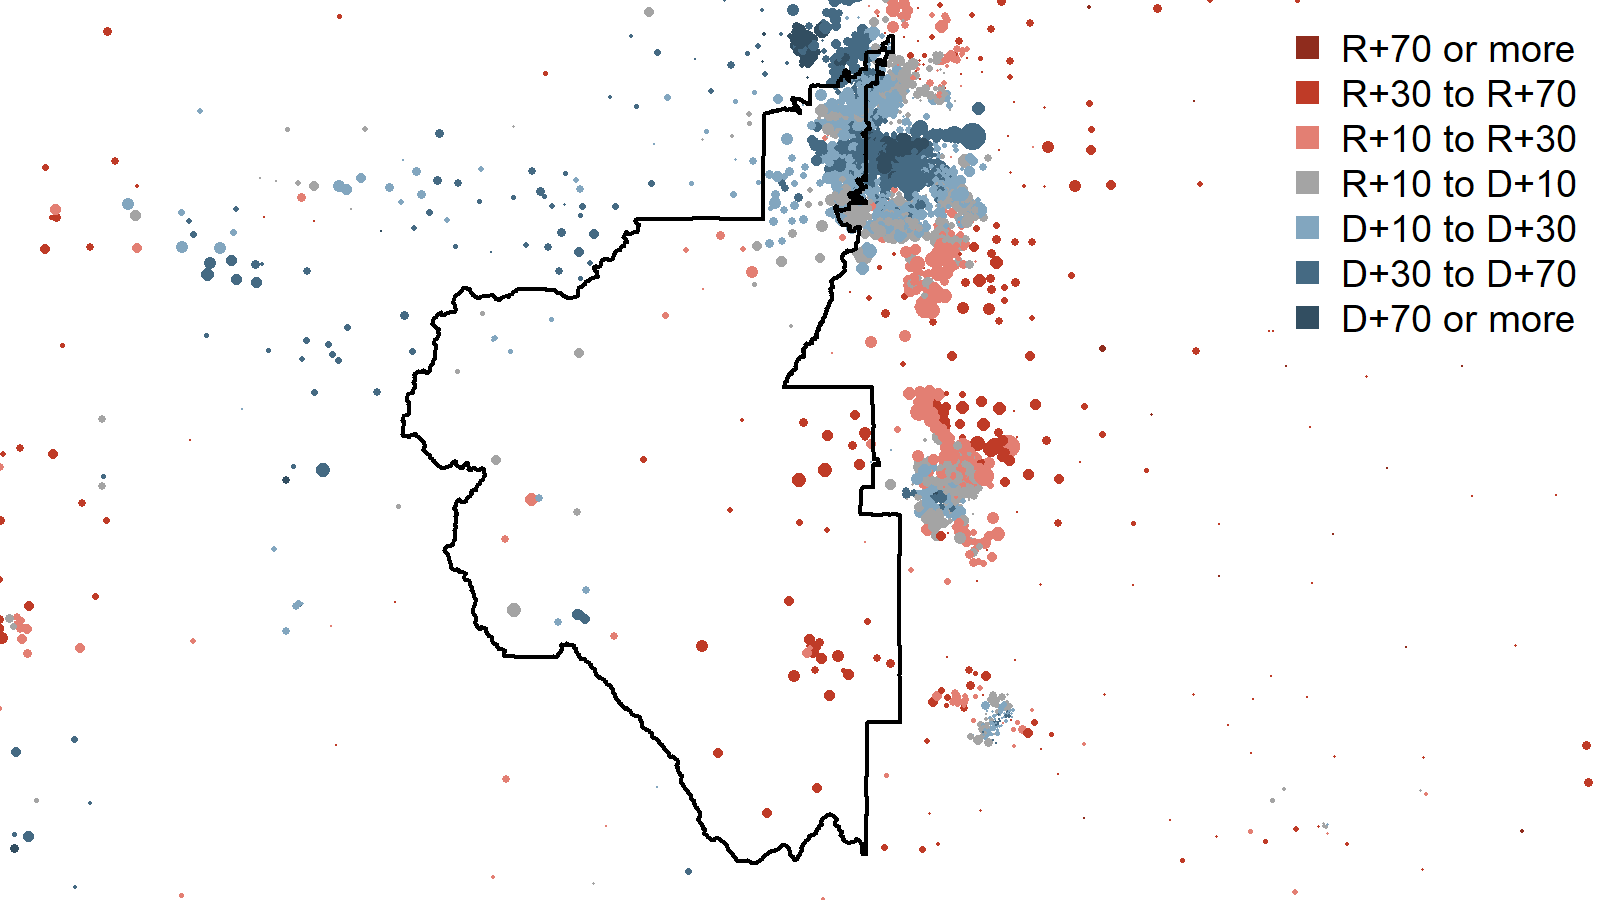
The most Democratic leaning parts of the district are in the heavily populated Denver metro area portions. Republicans do better in most of the more rural, mountainous areas of the district.
The relationship between educational attainment and 2024 Democratic vote
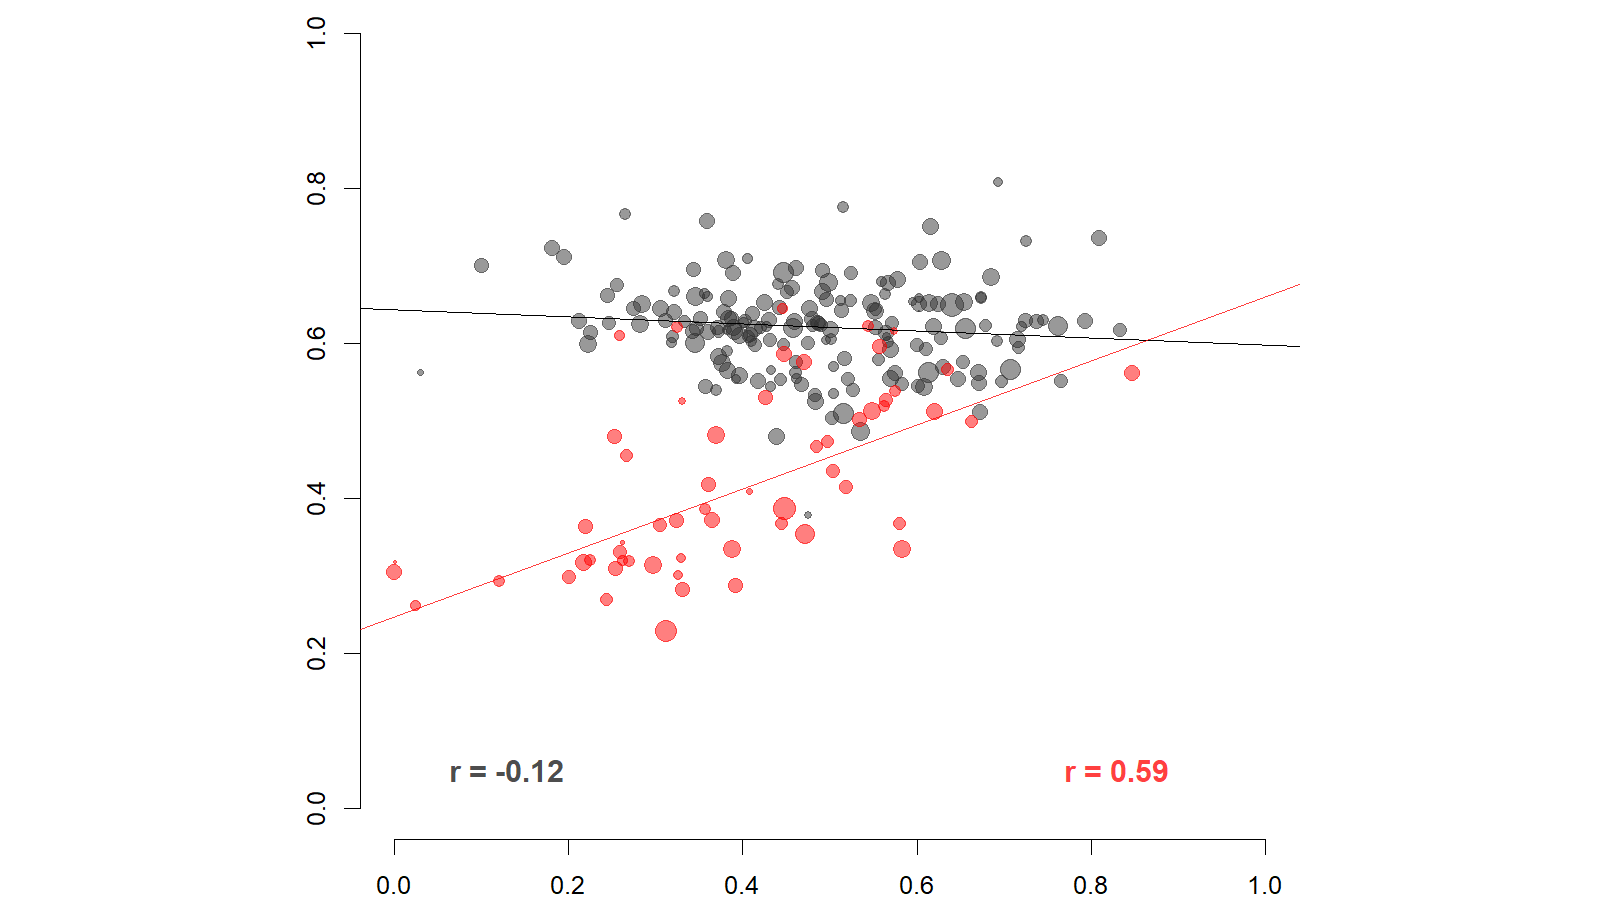
In the seventh district, more than any other in Colorado we see a clear bifurcation in the relationship between education and the share of a local neighborhood that voted Democratic in 2024. The plot shows two very different relationships depending on the part of the district. In the highly urbanized Denver metro portion (shown in grey in the plot), there is a very modest negative relationship between the share of a place with a college degree and Democratic vote. In the rest of the district, there is a much stronger relationship between the share of a place that has a college degree and Democratic vote (shown in red in the plot).
Click here for a listing of fact sheets for the other districts in the state.