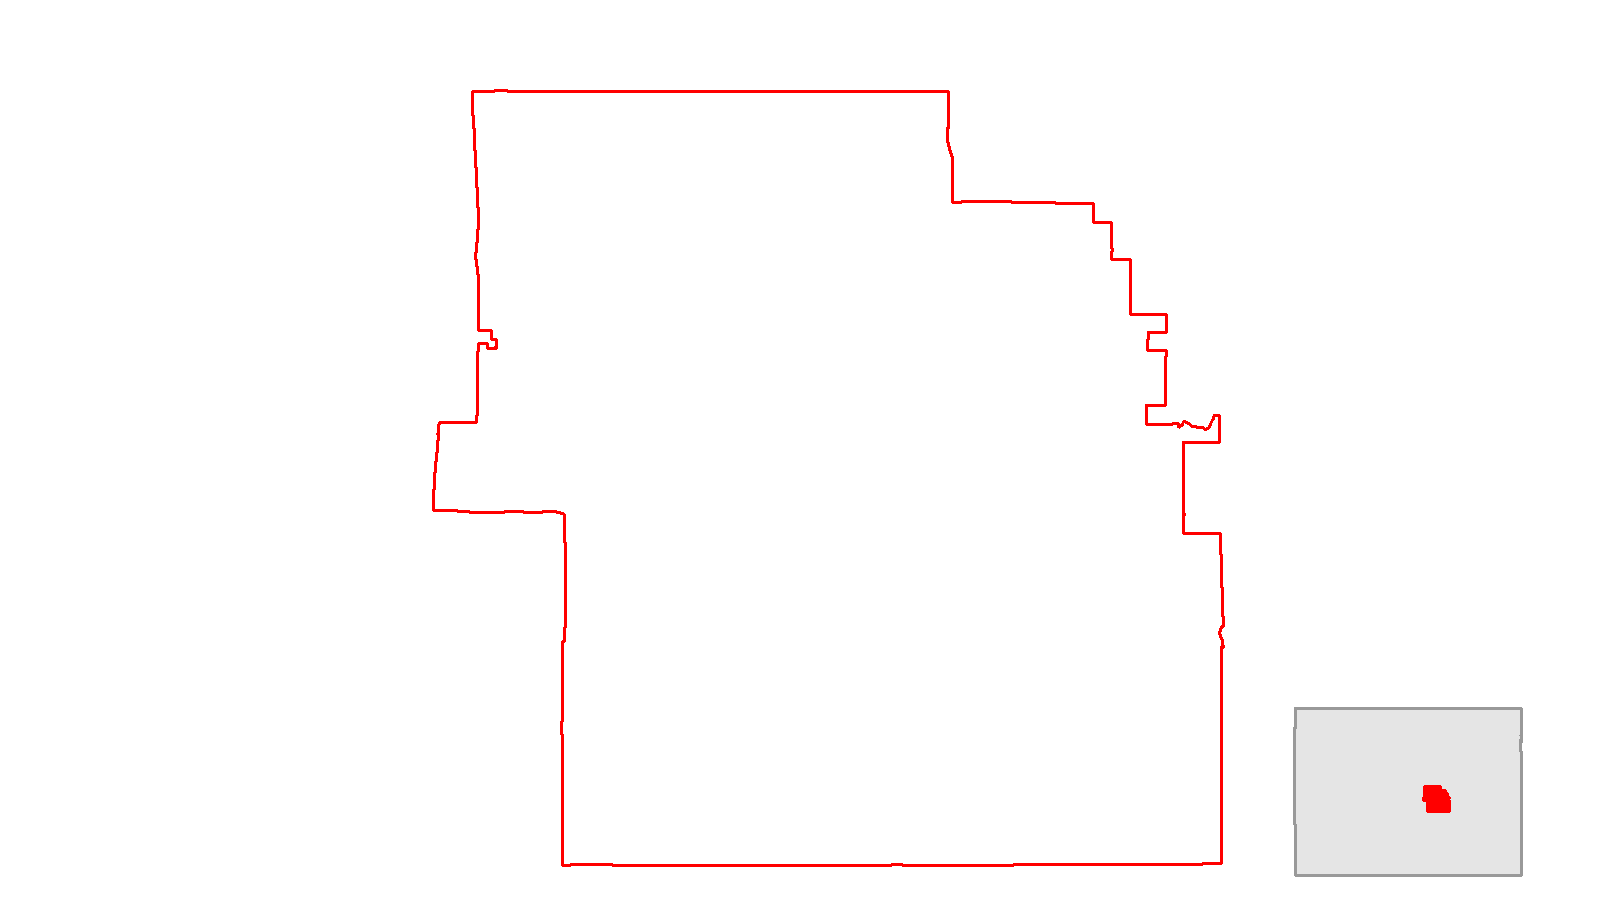
Notes: This map shows Colorado's fifth district. The inlaid map in the lower righthand corner shows the position of the district within the state. Sources: US Census Tiger/Line shapefiles.
Colorado’s fifth district is primarily composed of Colorado Springs and surrounding communities south of Denver. In many ways, this district closely mirrors the demographic trends of the rest of the state. The district has been represented by Jeff Crank since 2025.
Demographics
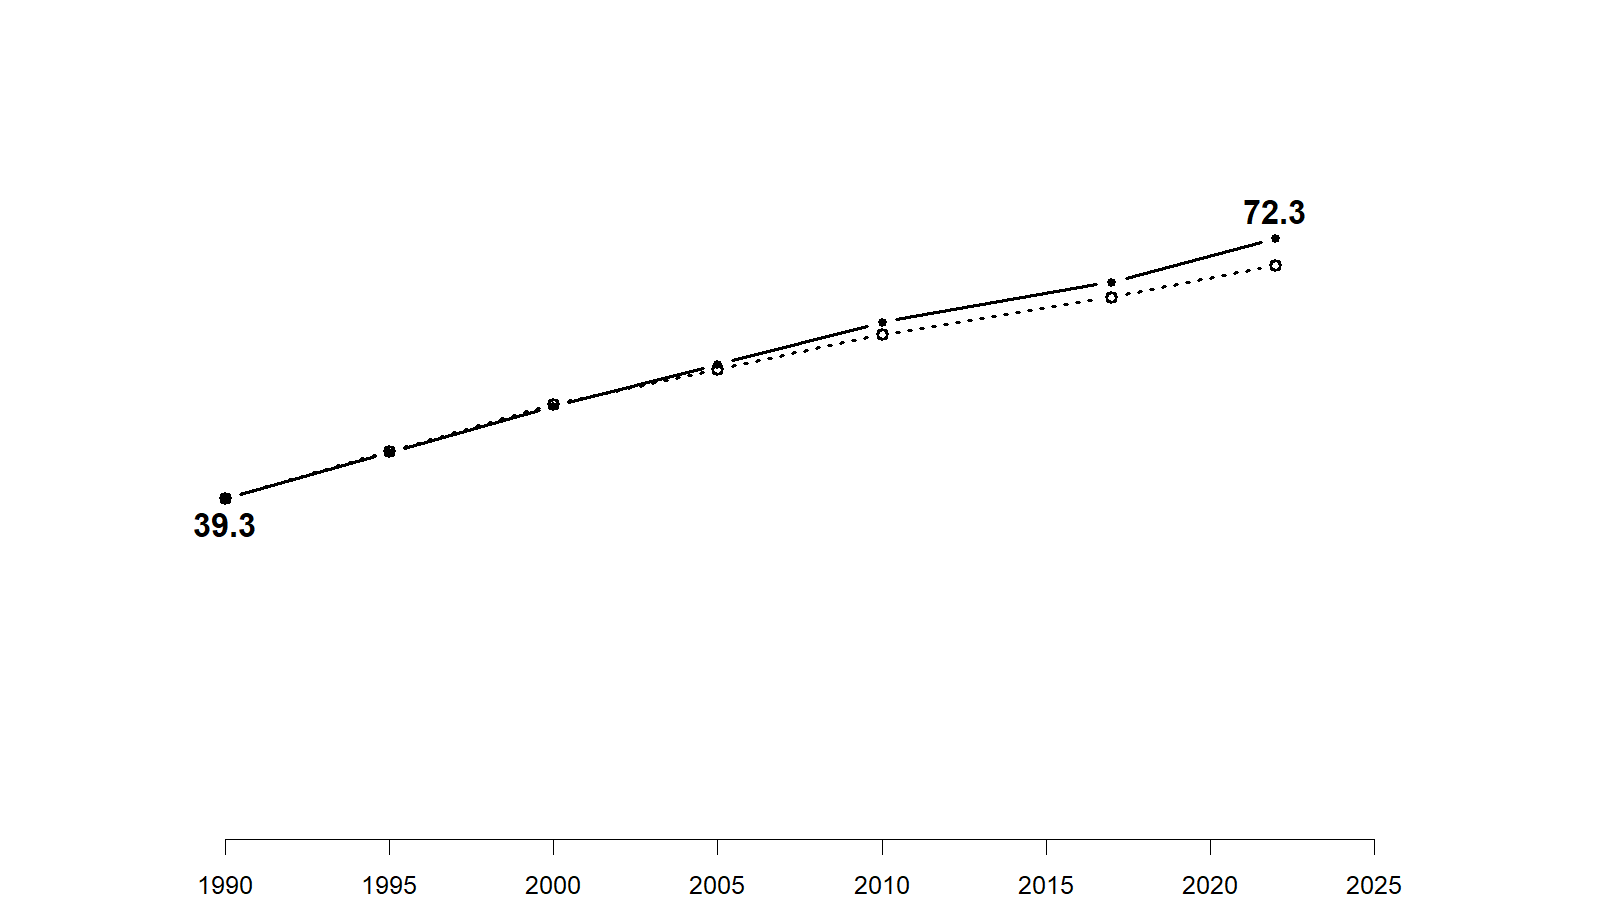
Population growth, 1990-2022
Notes: Population growth in the fifth district (solid line) compared to statewide trends (dotted line). The graphic shows percentage growth in the area and the data labels show the population in the area in 10,000s. Source: U.S. Census data compiled by the National Neighborhood Data Archive.
The population of the fifth district has grown on pace with the rest of the state. It started growing somewhat faster than the rest of the state in the 2010s.
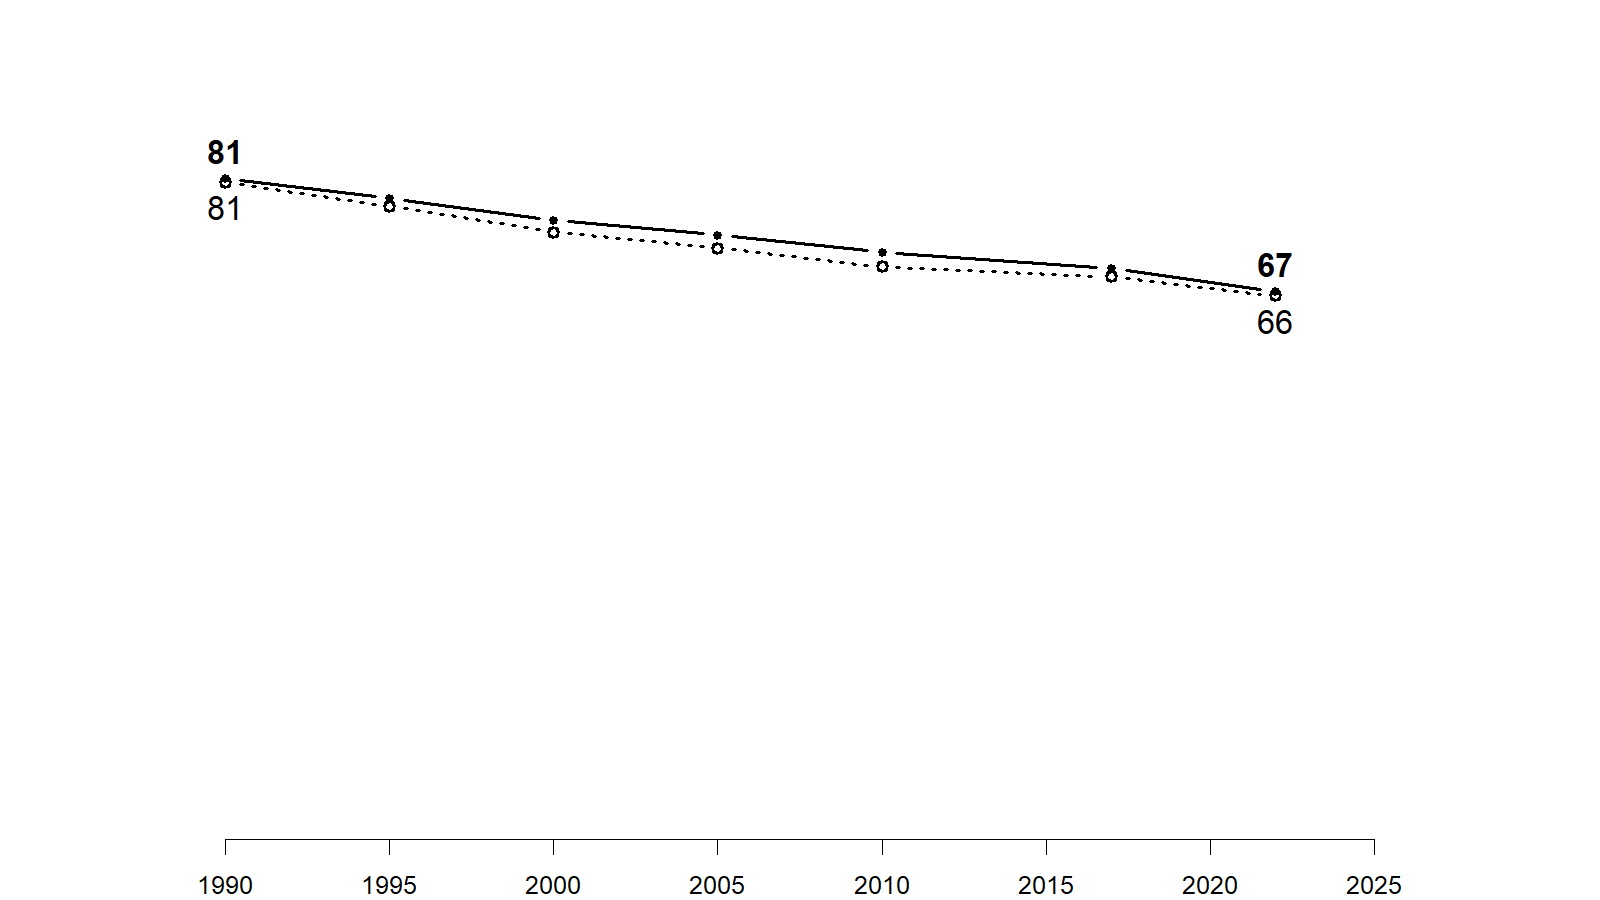
Share of the population that is White (non-Hispanic), 1990-2022
Notes: Share of the population that is non-Hispanic White. The solid line shows the trend in the district, the dotted line shows the statewide trend. Source: U.S. Census data compiled by the National Neighborhood Data Archive.
The share of non-Hispanic White people in the area now covered by the fifth district very closely mirrors the statewide trend during this period.
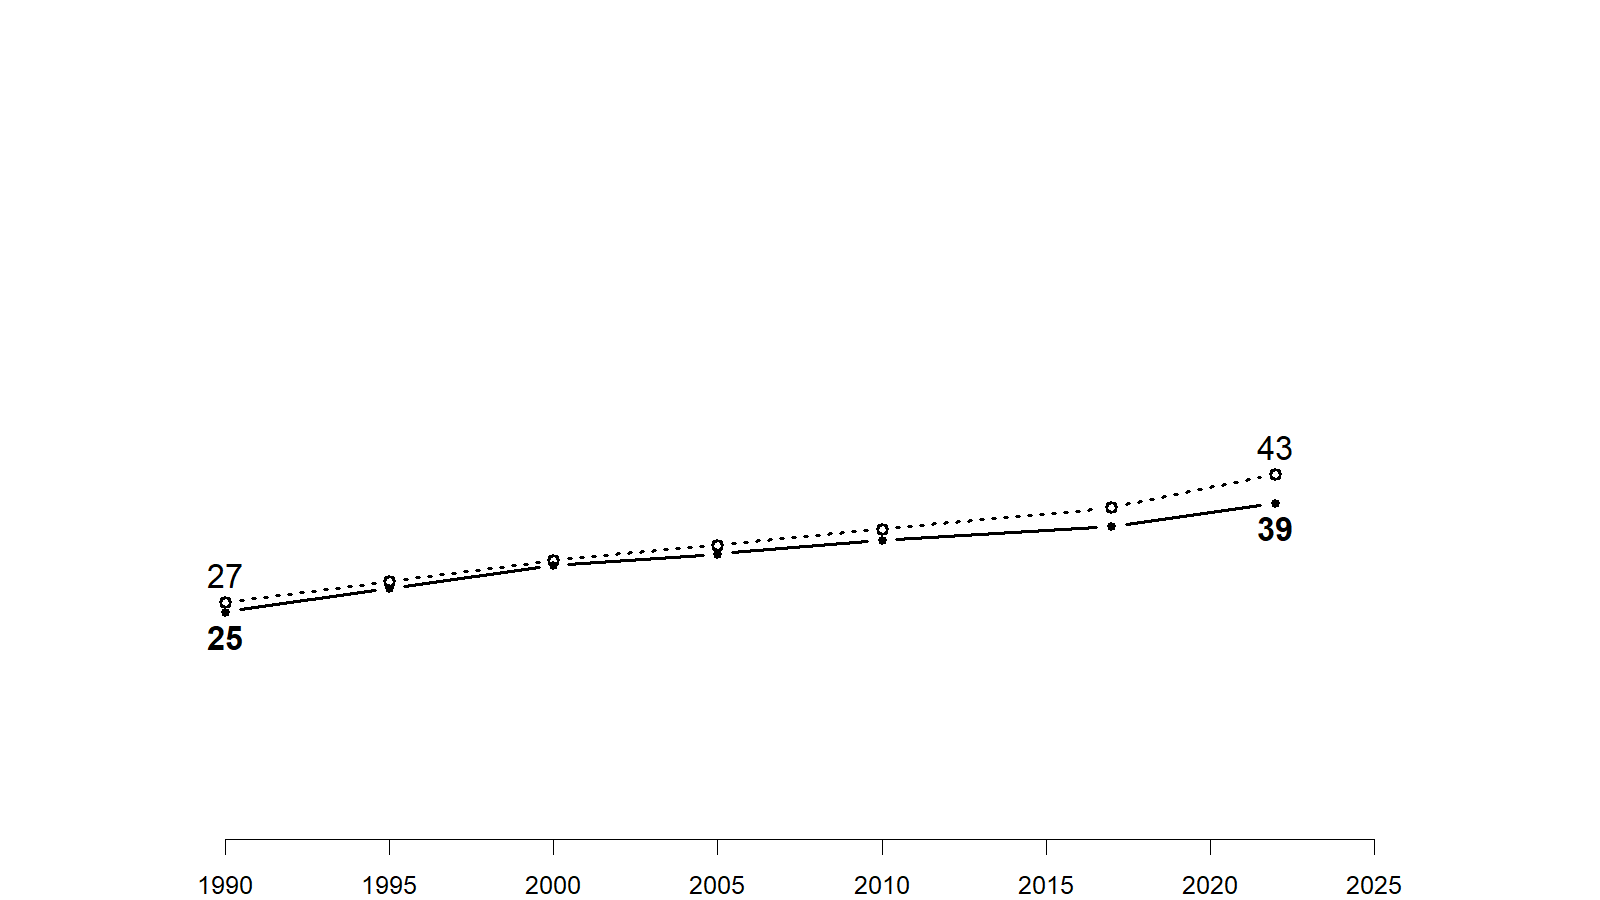
Share of the population with a college degree, 1990-2022
Notes: Share of the population that has a four-year college degree or more education. The solid line shows the trend in the district, the dotted line shows the statewide trend. Source: U.S. Census data compiled by the National Neighborhood Data Archive.
The share of the population in the fifth district with a college degree is now somewhat lower than the statewide average. The gap opened up sometime in the 2010s.
Development
Land cover, 1985-2024
Notes: This animation shows the change in land cover from 1985-2024. Development is shown in grey, farmland is shown in yellow, water is shown in blue, grass/scrubland is shown in brown. Source: National Land Cover Database derived from satellite imagery.
The populated area of the fifth district is primarily composed of Colorado Springs and its suburbs. This area has grown substantially during the past 45 years.
Politics
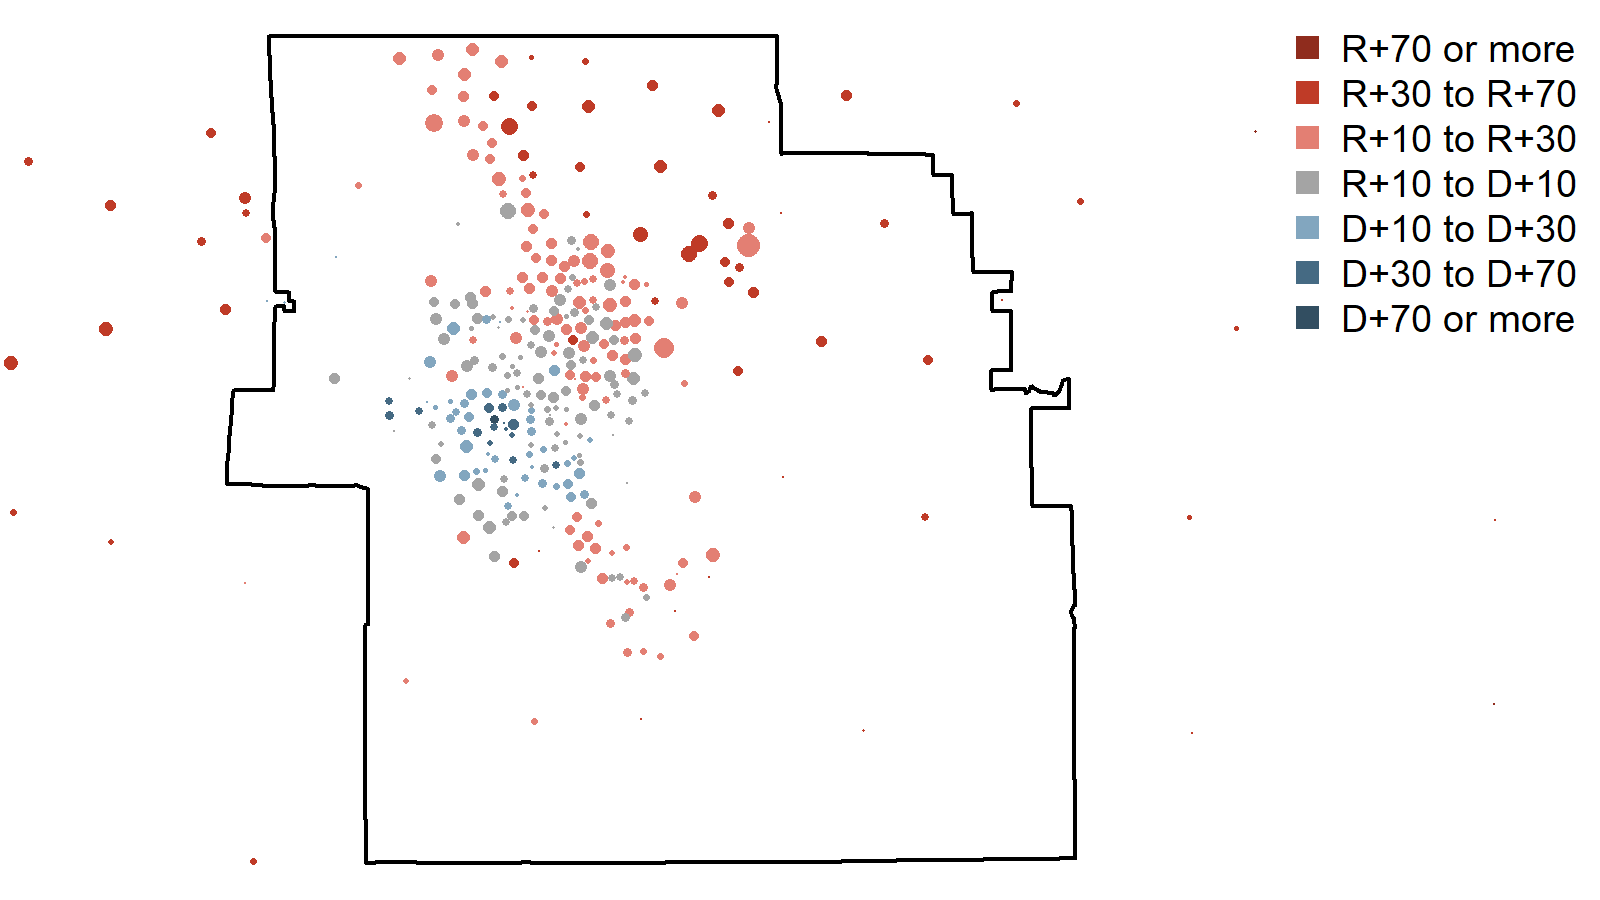
Notes: This plot shows the two-party vote in each precinct. Each point is drawn proportional to the number of votes cast in that precinct in 2024 and colored according to the margin. Sources: Precinct voting data compiled by the New York Times Upshot. Congressional district boundaries from Census Tiger/Line file.
The fifth district is one of the most Republican district in its voting patterns in the state. In the 2024 election, nearly 55 percent of voters in the district supported Trump compared to 43% support statewide. The most Democratic areas are in the southwestern parts of the city, and the most Republican areas are in the northern and eastern part of the district.
The relationship between educational attainment and 2024 Democratic vote
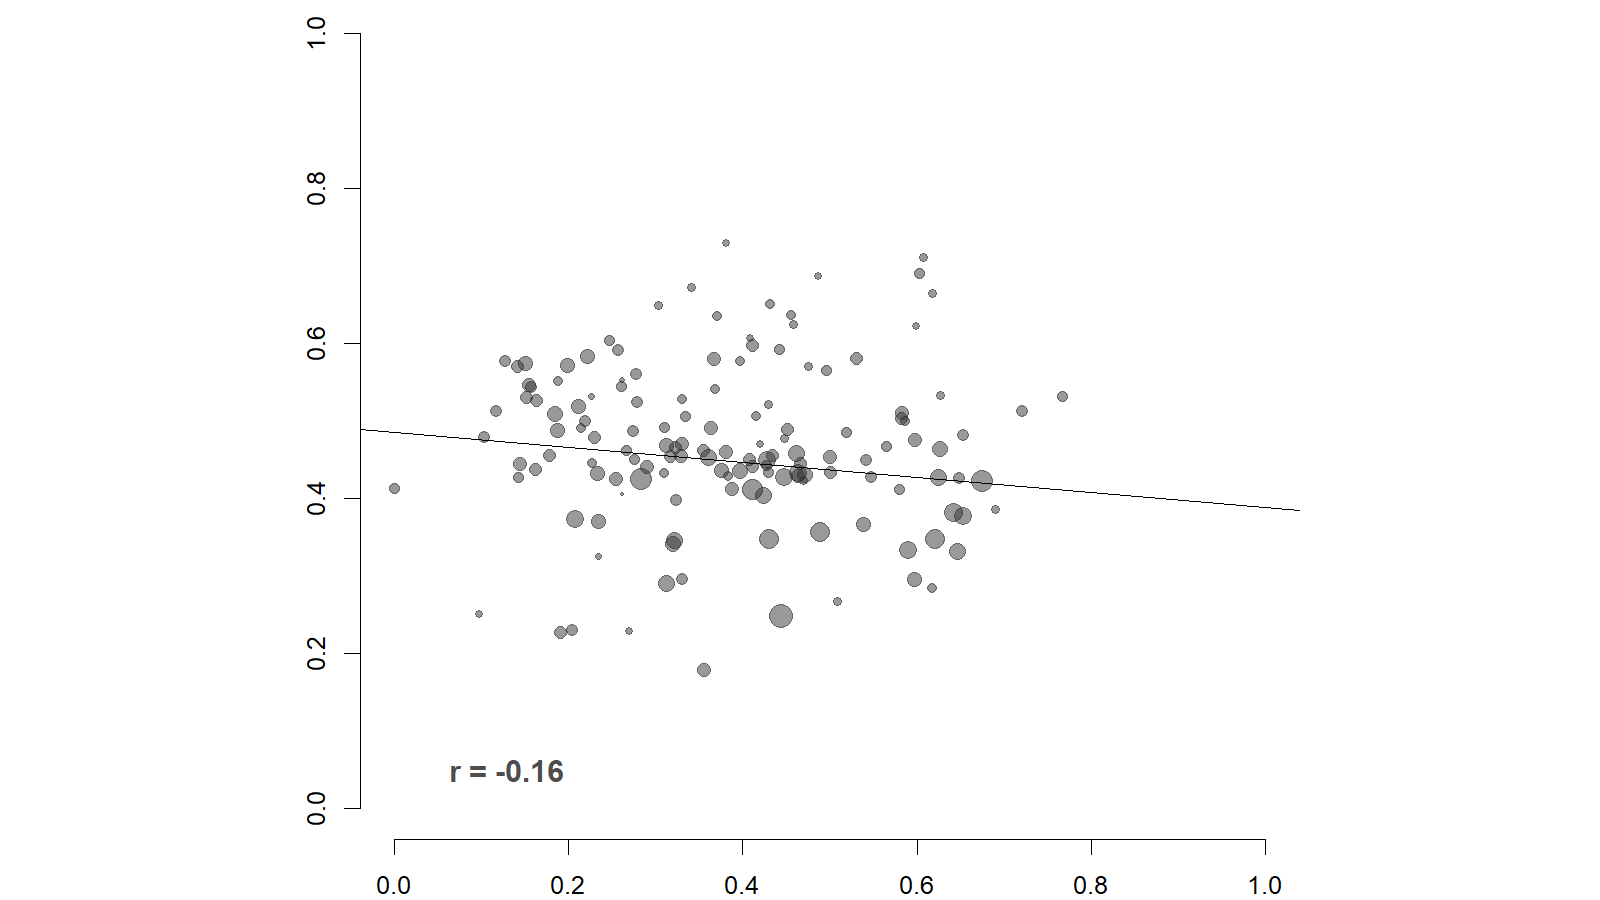
Notes: This graphic shows the relationship between the share of a Census tract that has a college degree or greater and two-party Democratic vote in 2024. The Pearson's correlation coefficient is shown in the bottom left-hand corner, and the line-of-best-fit is drawn through the data. Sources: Tract-level educational attainment, US Census compiled by NaNDA. Presidential vote share from the NYT Upshot projected to the tract-level by the author.
Unlike many other districts in the state, there is very little relationship between the share of a neighborhood with a college degree and Democratic vote in that area. To the extent that a relationship exists, it actually runs in the opposite direction with more highly educated areas supporting Trump over Harris on average (though as noted, the relationship is not strong).
The relationship between racial and ethnic composition and 2024 Democratic vote
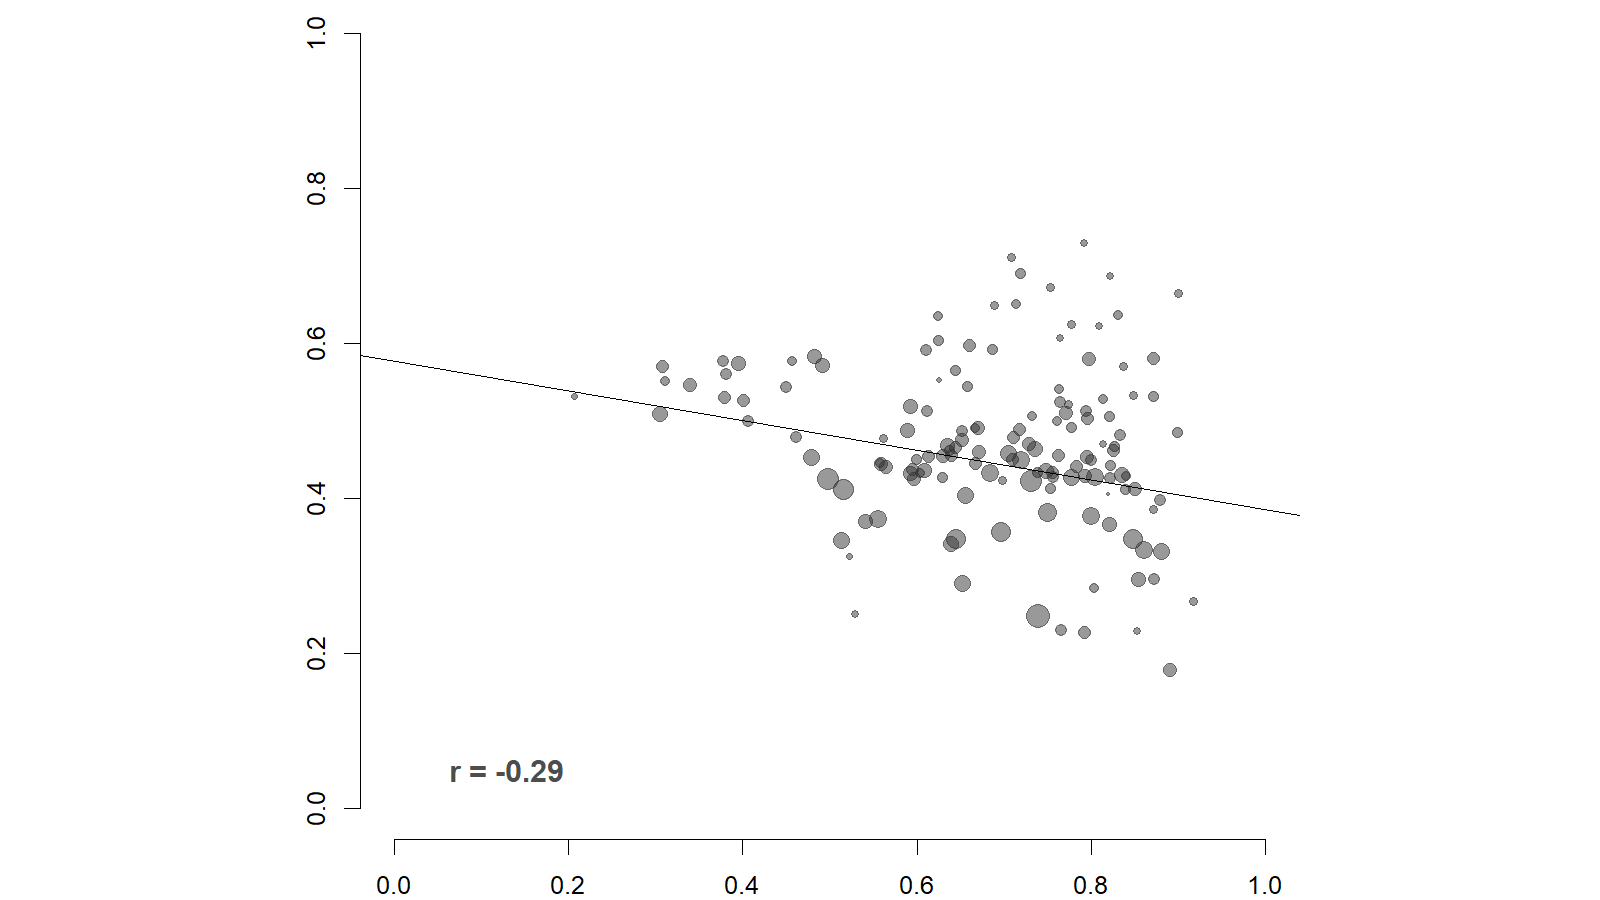
Notes: This graphic shows the relationship between the share of a Census tract that has a college degree or greater and two-party Democratic vote in 2024. The Pearson's correlation coefficient is shown in the bottom left-hand corner, and the line-of-best-fit is drawn through the data. Sources: Tract-level educational attainment, US Census compiled by NaNDA. Presidential vote share from the NYT Upshot projected to the tract-level by the author.
The parts of the district that had greater shares of White residents were somewhat more likely to support Trump, and the relationship between racial composition and voting patterns was stronger than the relationship with education.
Sign up for Colorado's Political Landscape
Data-driven exploration of the drivers of Colorado politics
No spam. Unsubscribe anytime.
Click here for a listing of fact sheets for the other districts in the state.