Colorado’s 2nd Congressional District: Fact Sheet

Colorado’s second district is located in the northern part of the state and borders Wyoming on its northernmost end. The college towns of Fort Collins and Boulder fall within the second district. The district has been represented by Joe Neguse since 2019.
Demographics
Population growth, 1990-2022
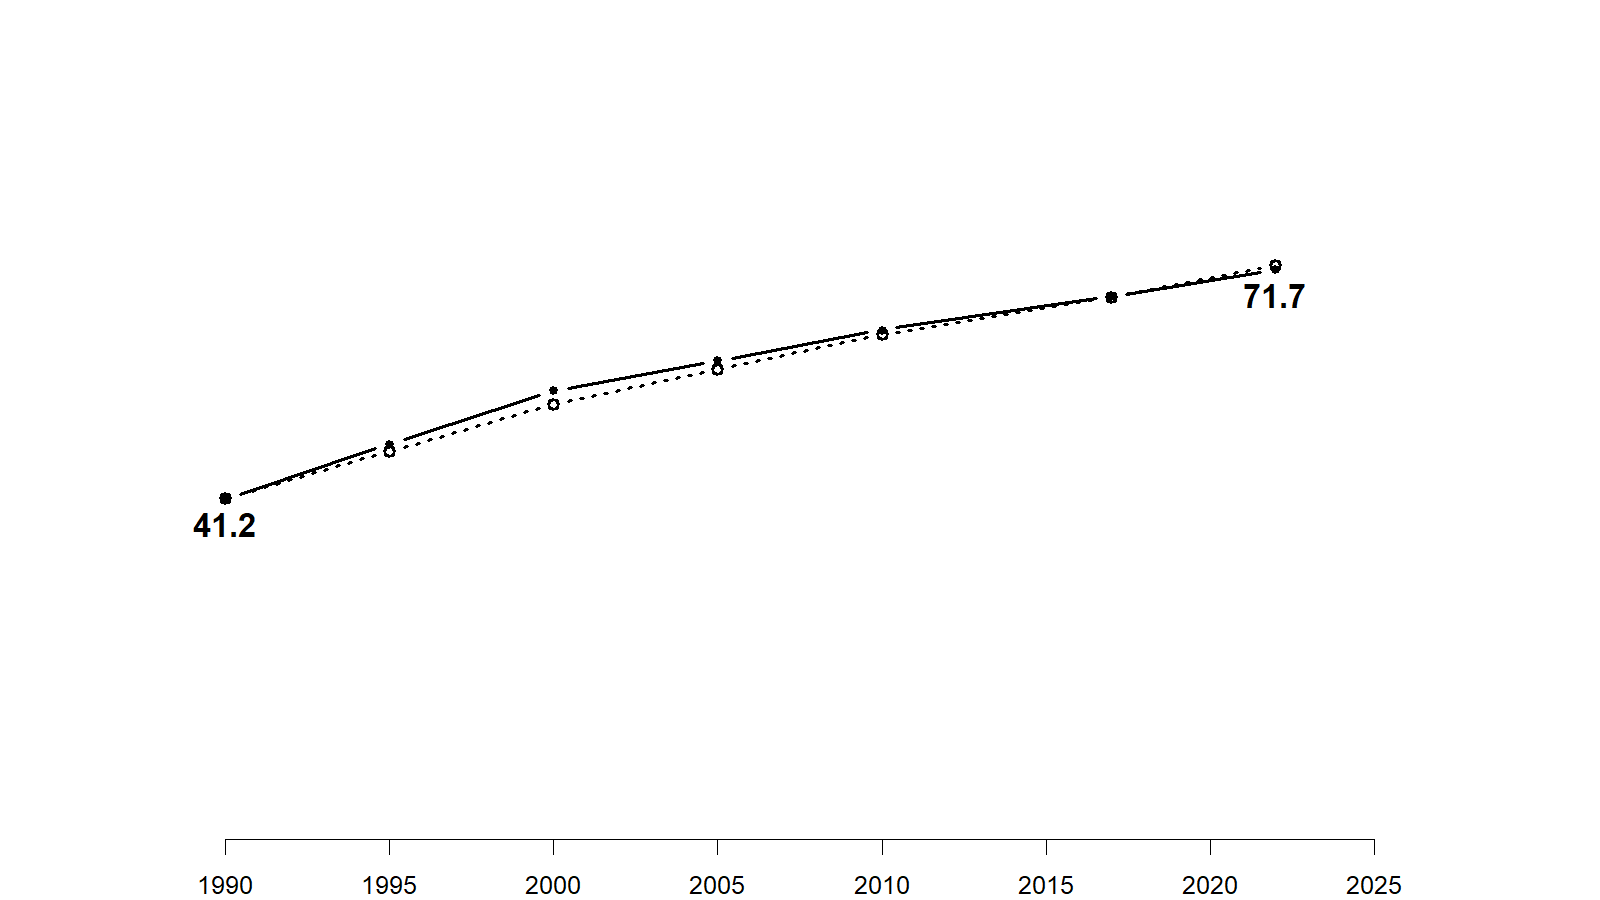
Since 1990, Colorado's population has grown by over 75%. Population growth in the area covered by the second district tracked statewide population growth closely.
Share of the population that is White (non-Hispanic), 1990-2022
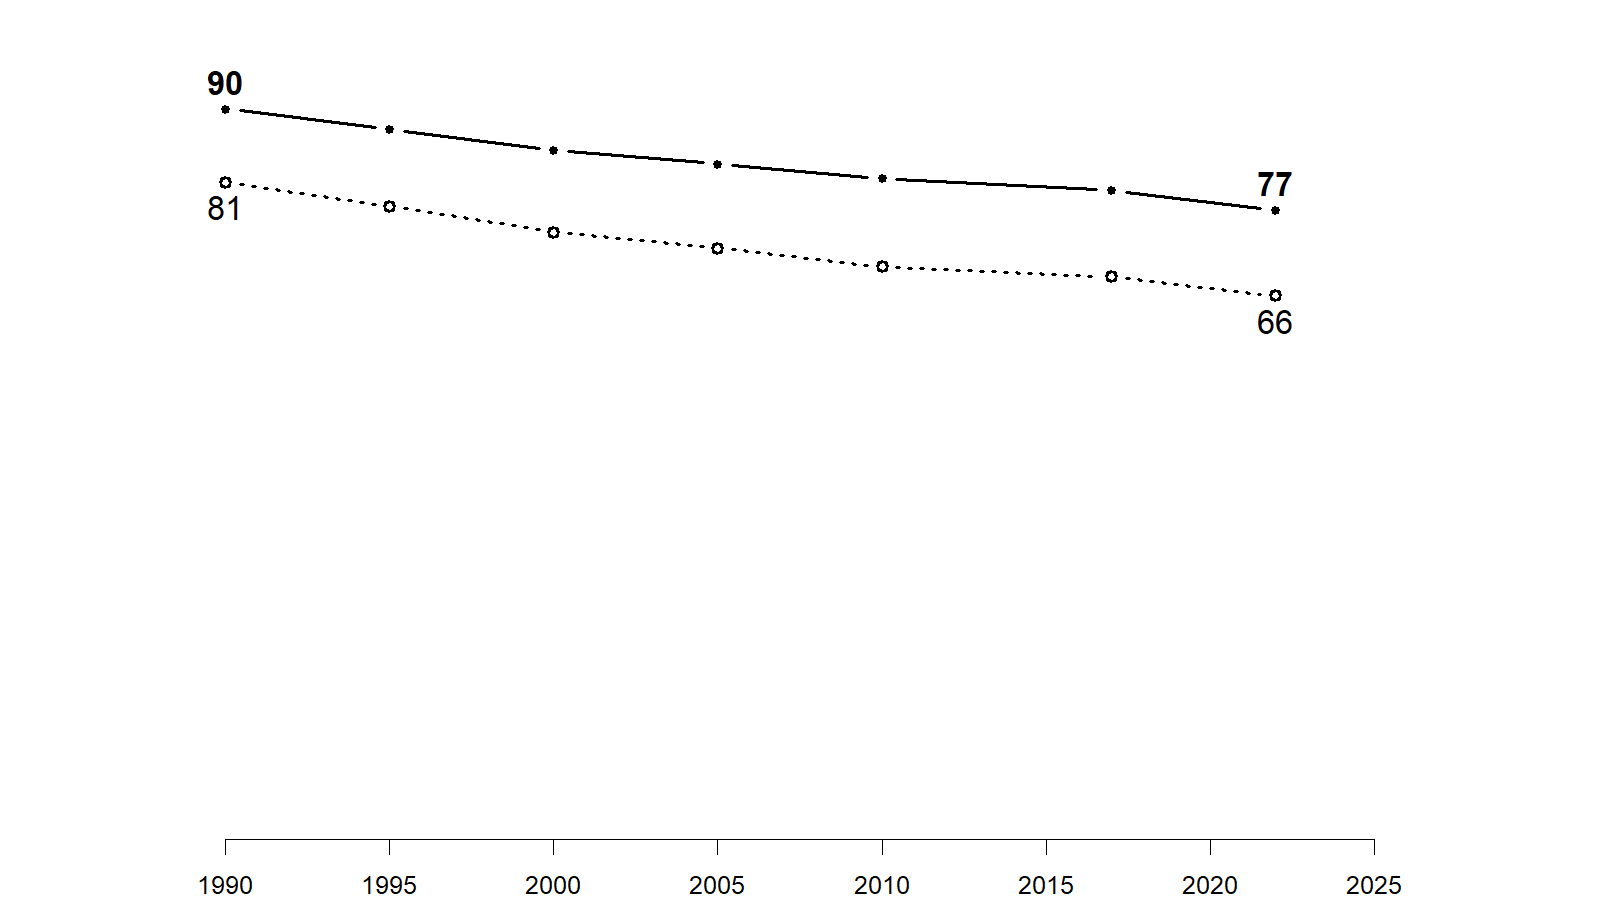
The population in the second district is significantly less diverse compared to the rest of the state's population. In 1990, the second district's population was about 10 percent more White than the state's population. That 10 percentage point gap has persisted during this period.
Share of the adult population that is under 40, 1990-2022
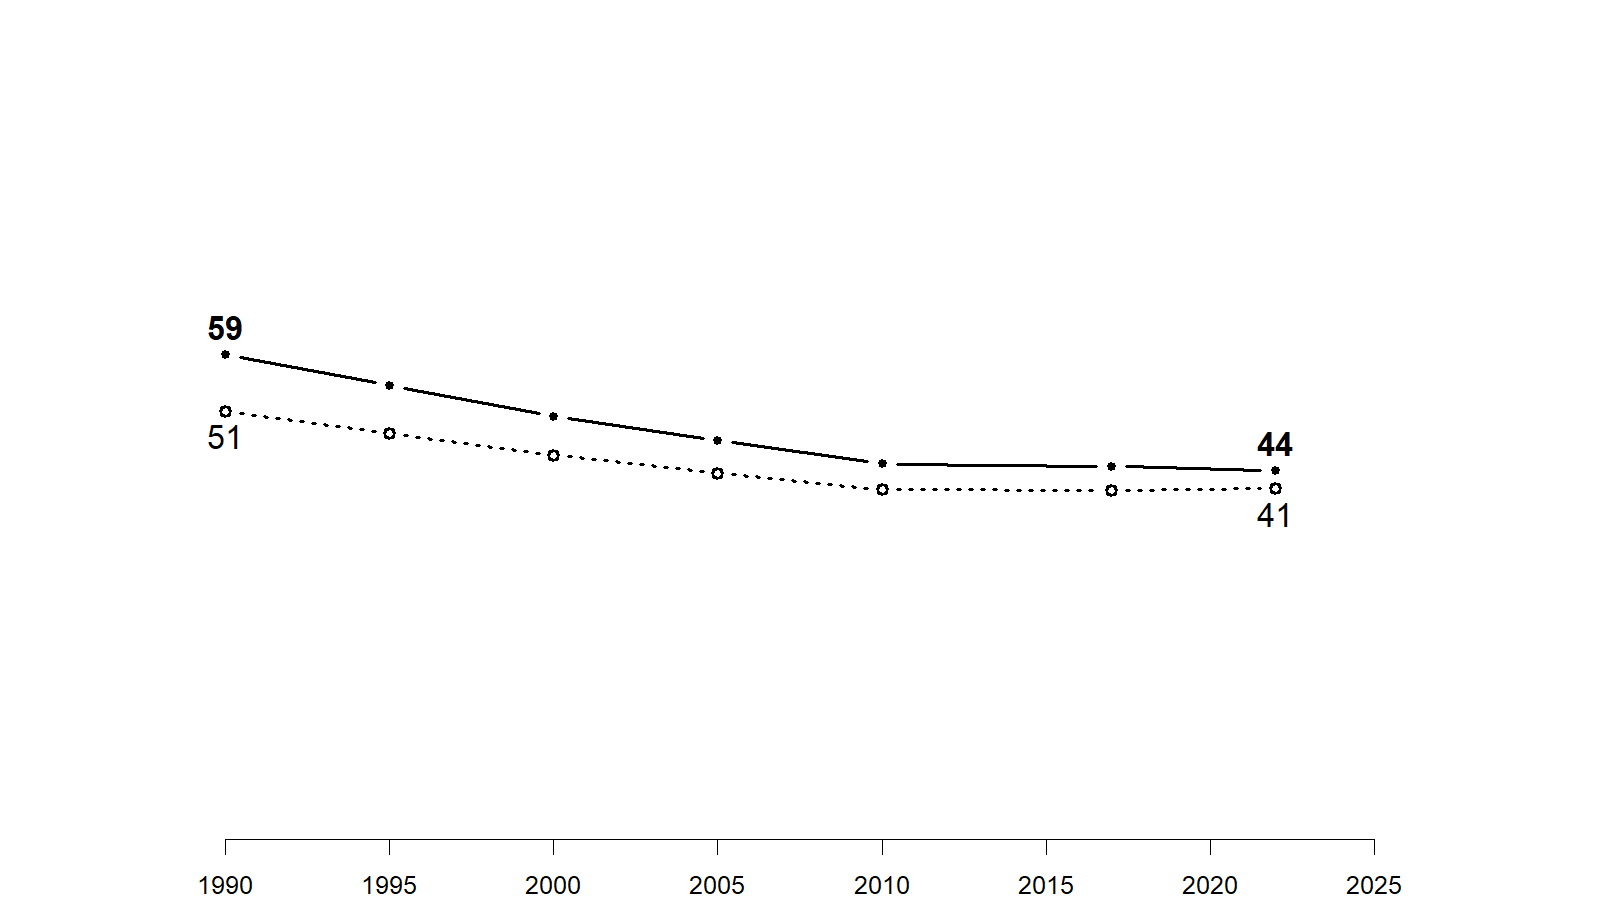
In 1990, about half of Colorado's adult population was under 40 years old. At the same time, the share of the adult population living in the area now in the second district was substantially younger than the statewide average. Since then, the population in the second district has aged faster than the statewide average during this period, and the gap today is negligible.
Development
Land cover, 1985-2024
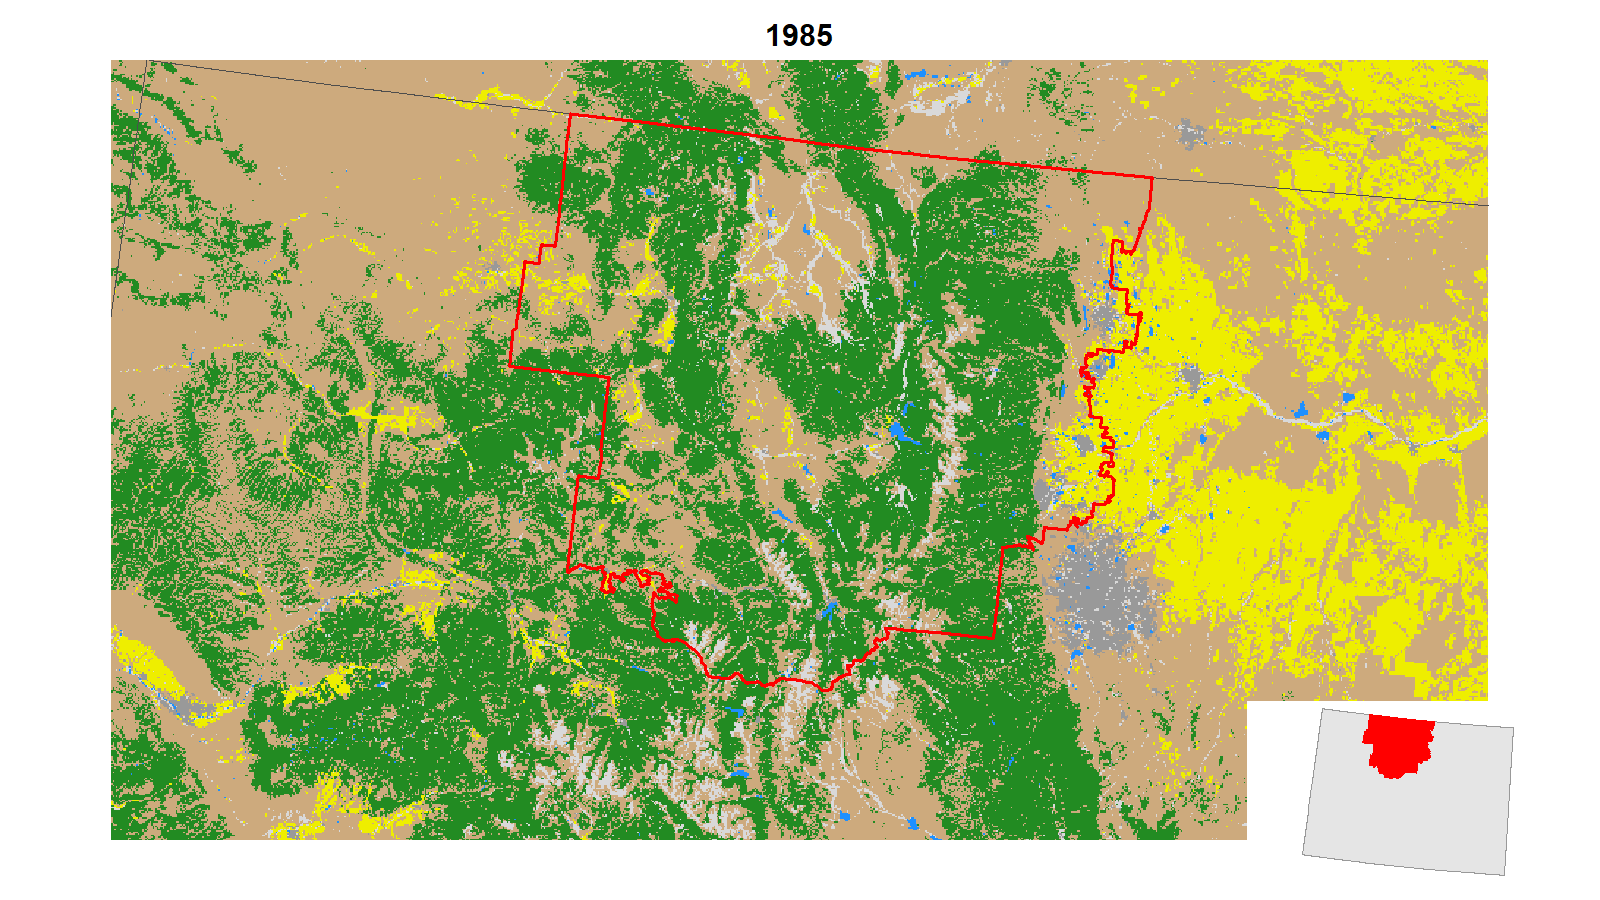
A large share of the second district includes the northern part of the Rocky Mountains. Since 1985, the share of the second district that was developed has nearly doubled. This has come mostly at the expense of land that was previously used for agriculture. There has also been a fair amount of deforestation within the second district bounds during this period primarily as a result of wildfires. The 2020 Cameron Peak fire is especially visible in the satellite data in 2020.
Politics
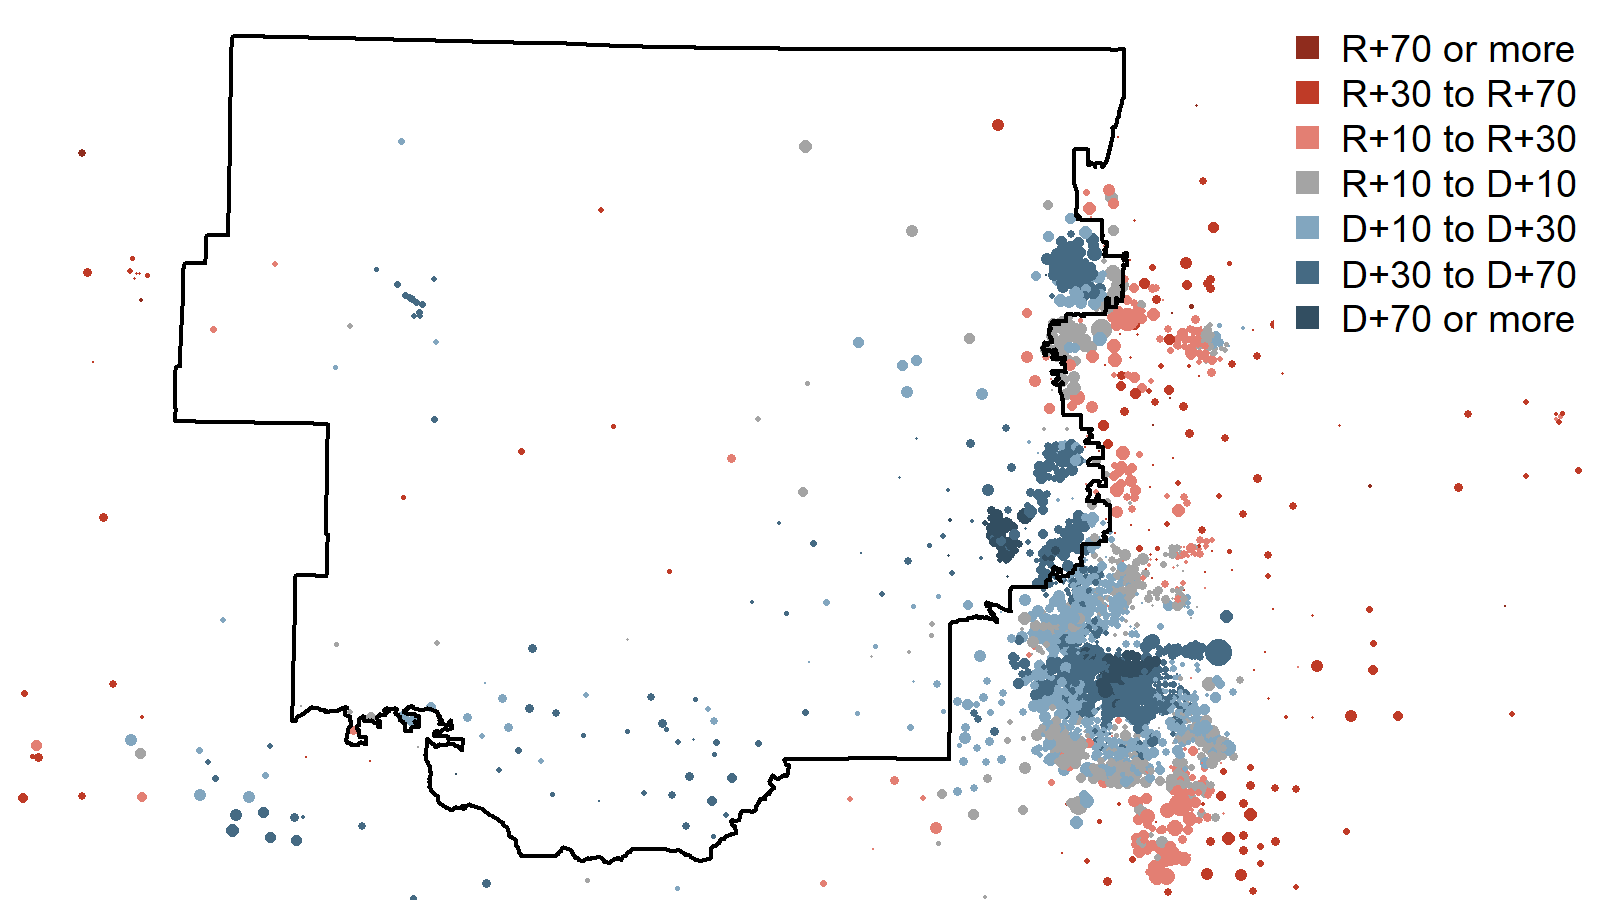
The second district is substantially more Democratic in its voting patterns than the rest of the state. In the 2024 election, nearly 70% of the second district supported Harris compared to 54% support statewide. The biggest Democratic strongholds in the district are in the Boulder and Fort Collins areas. Republican voters are more diffuse through the district. In 2024, the sparsely populated northeast corner of the district voted for Trump over Harris by a margin of two to one. Trump received similar margins in some of the smaller mountain towns in the center of the district.
The relationship between educational attainment and 2024 Democratic vote
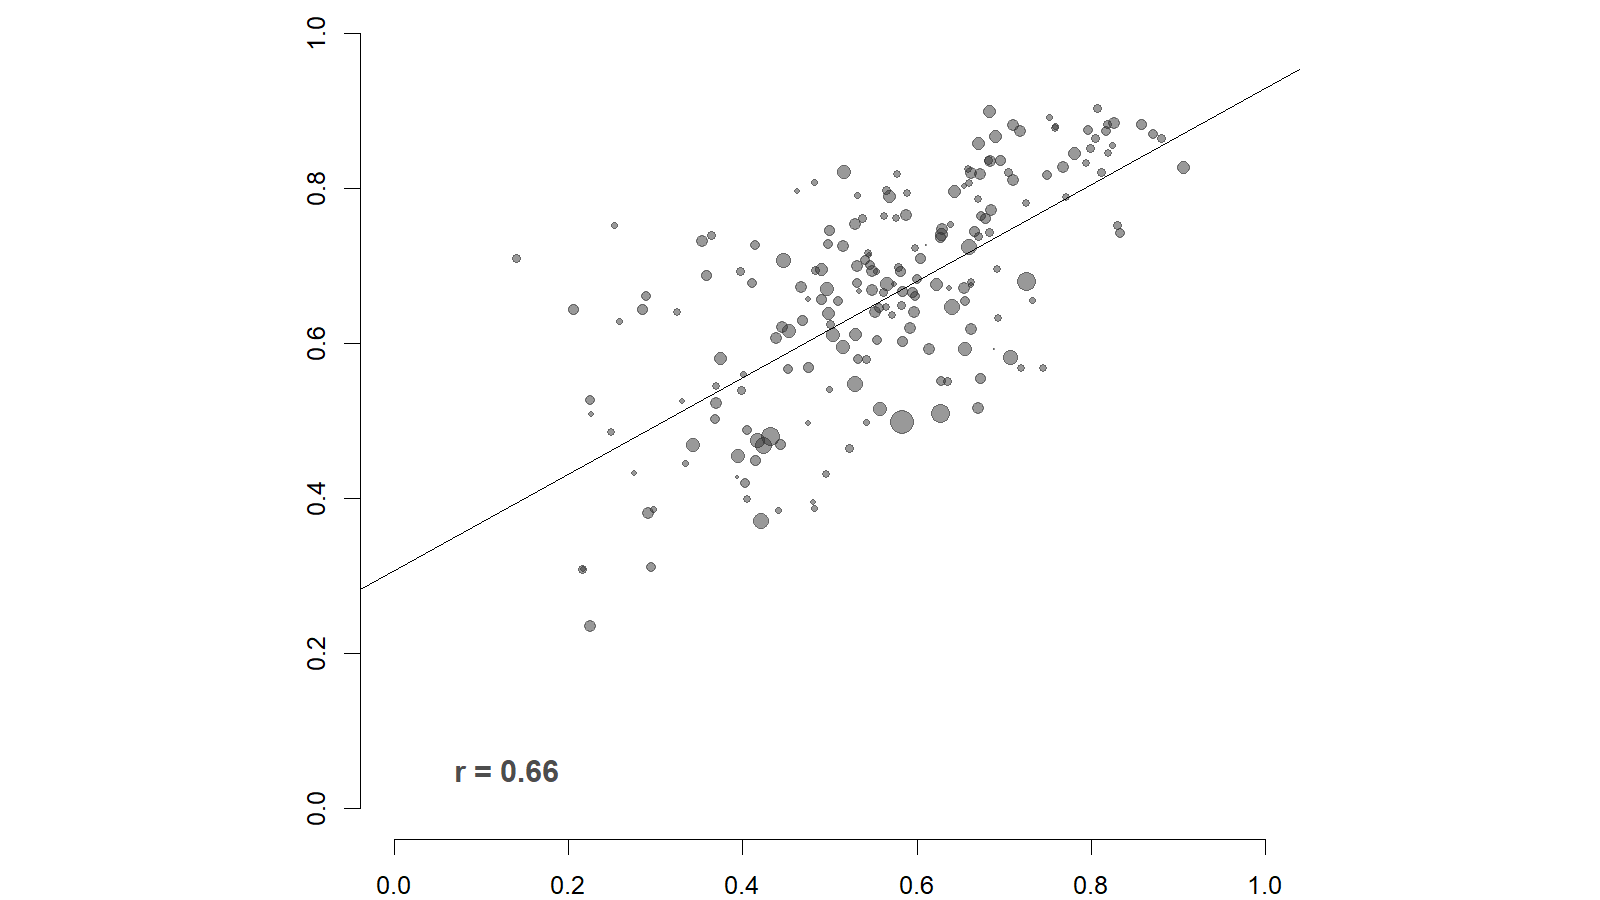
Within the second district – at least in 2024 – there was a strong relationship between neighborhood-level educational attainment and Democratic support. The areas of the district with the lowest rates of college graduates showed much less support for Harris on average compared to the parts of the district with the highest levels of educational attainment.
Click here for a listing of fact sheets for the other districts in the state.