Colorado’s 4th Congressional District: Fact Sheet


Colorado’s fourth district makes up most of the eastern part of the state. This area is dominated by agriculture and oil extraction. The biggest cities within the district are Highlands Ranch, Parker and Loveland in the western part of the district. The district has been represented by Lauren Boebert since 2025 (who had previously served in the 3rd district beginning in 2021).
Demographics
Population growth, 1990-2022
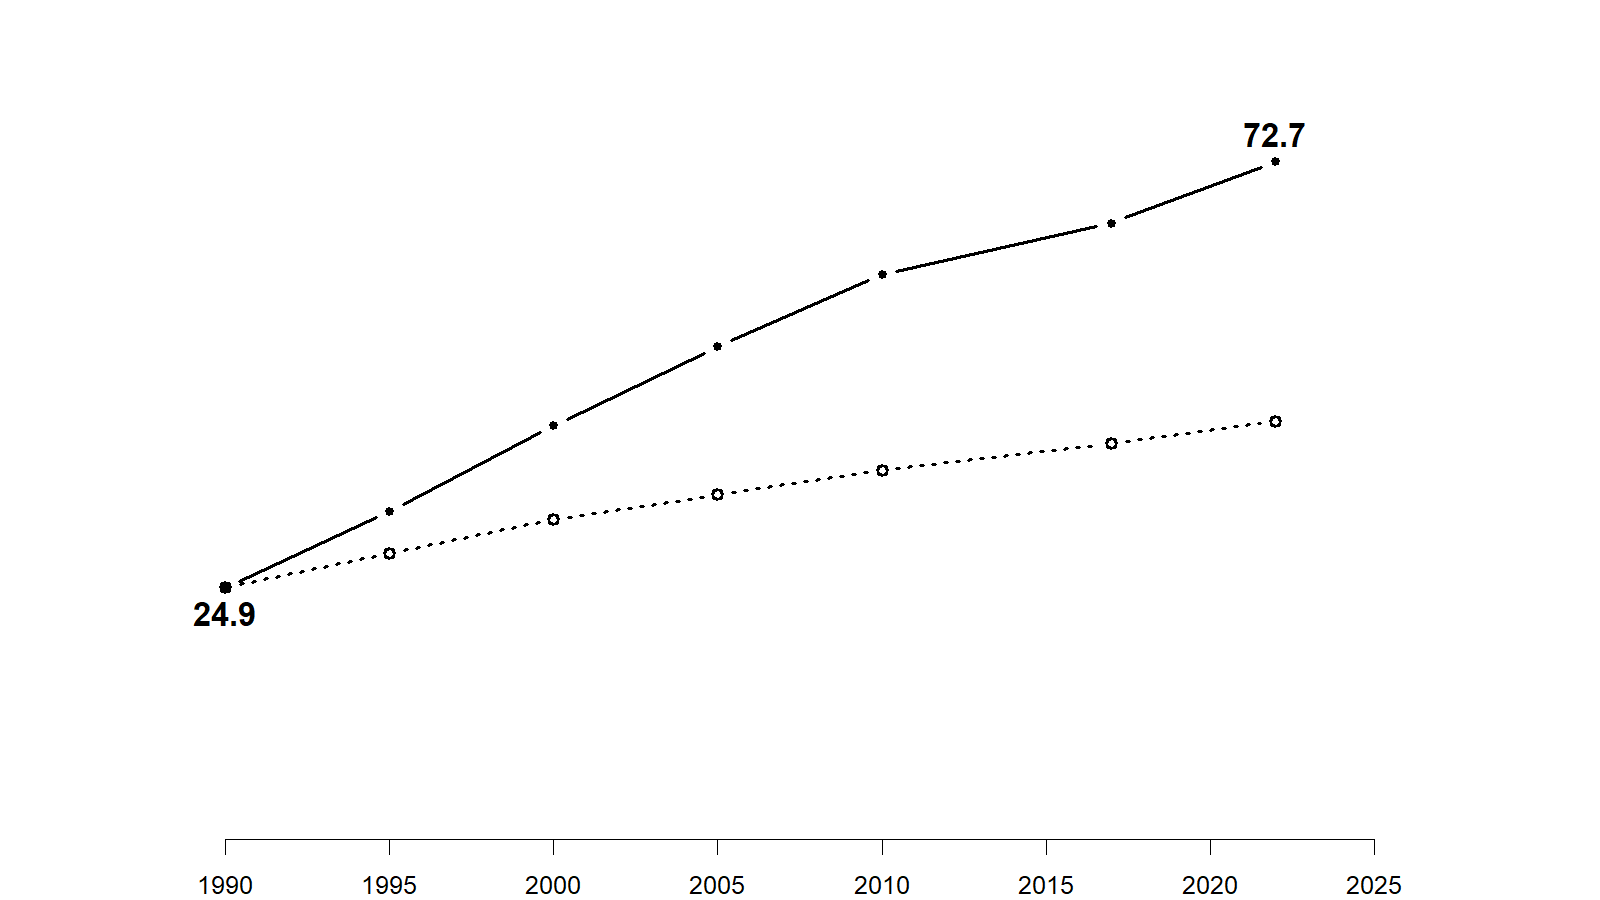
This area of the state has seen the most significant growth compared to any other district. The population of the fourth district has roughly tripled over the past 35 years.
Share of the population that is White (non-Hispanic), 1990-2022
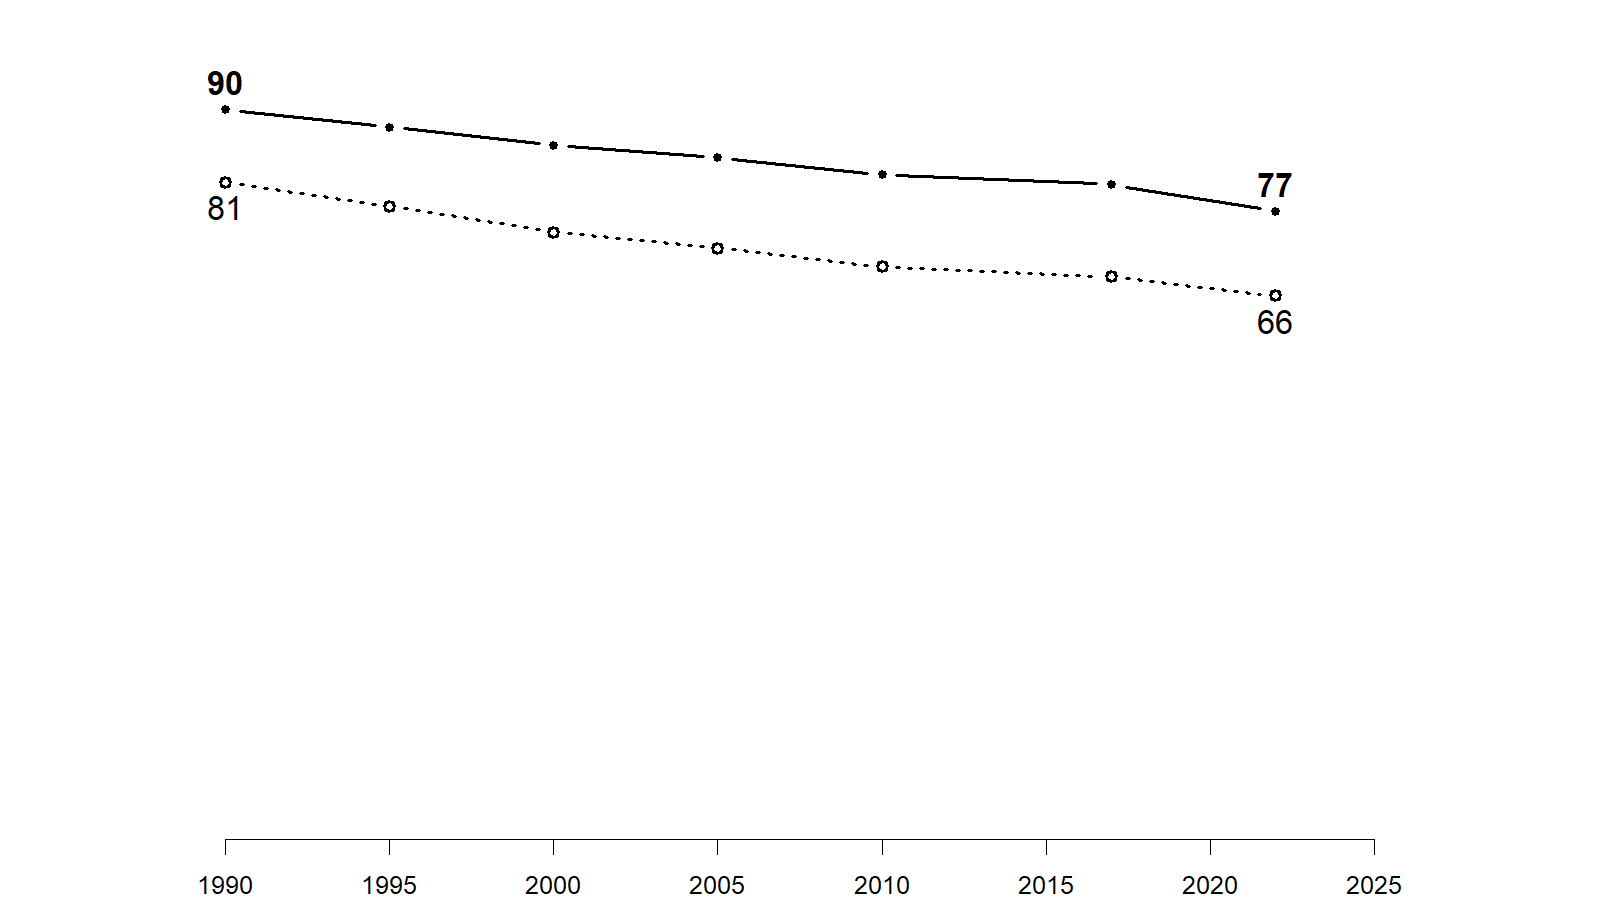
The fourth district is substantially less diverse than the rest of the state. The gap has remained constant over this period.
Share of the population with a college degree, 1990-2022
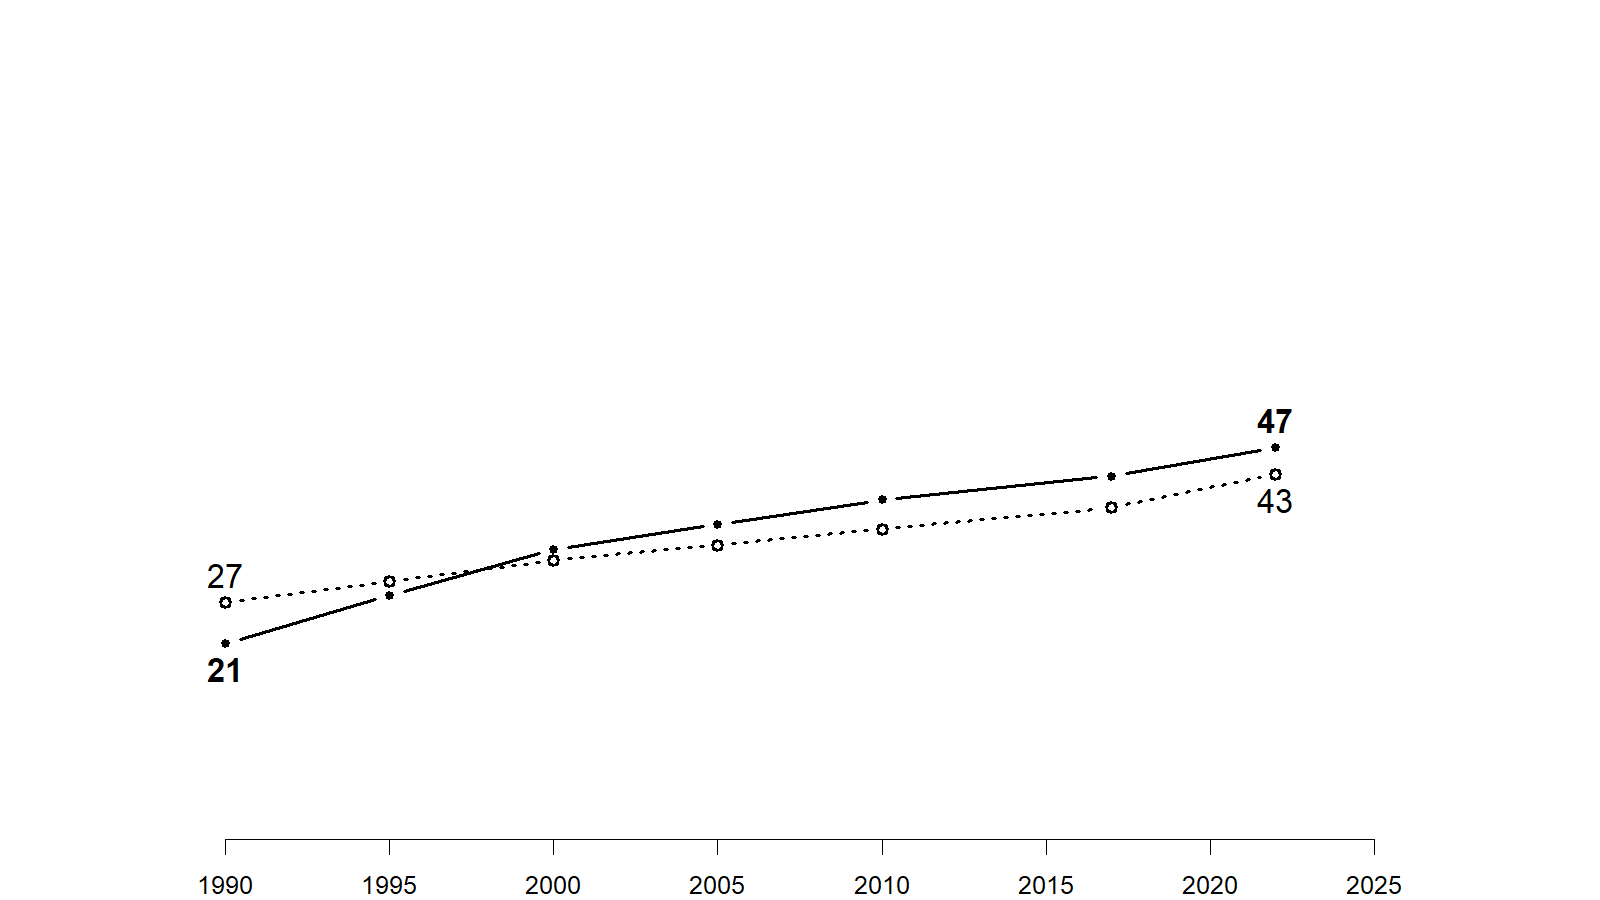
In 1990, the population living in the fourth district was somewhat less likely to have a college degree compared to the rest of the state. Today, the fourth district has somewhat higher rates of college education compared to the rest of the state.
Share of the adult population that is under 40, 1990-2022
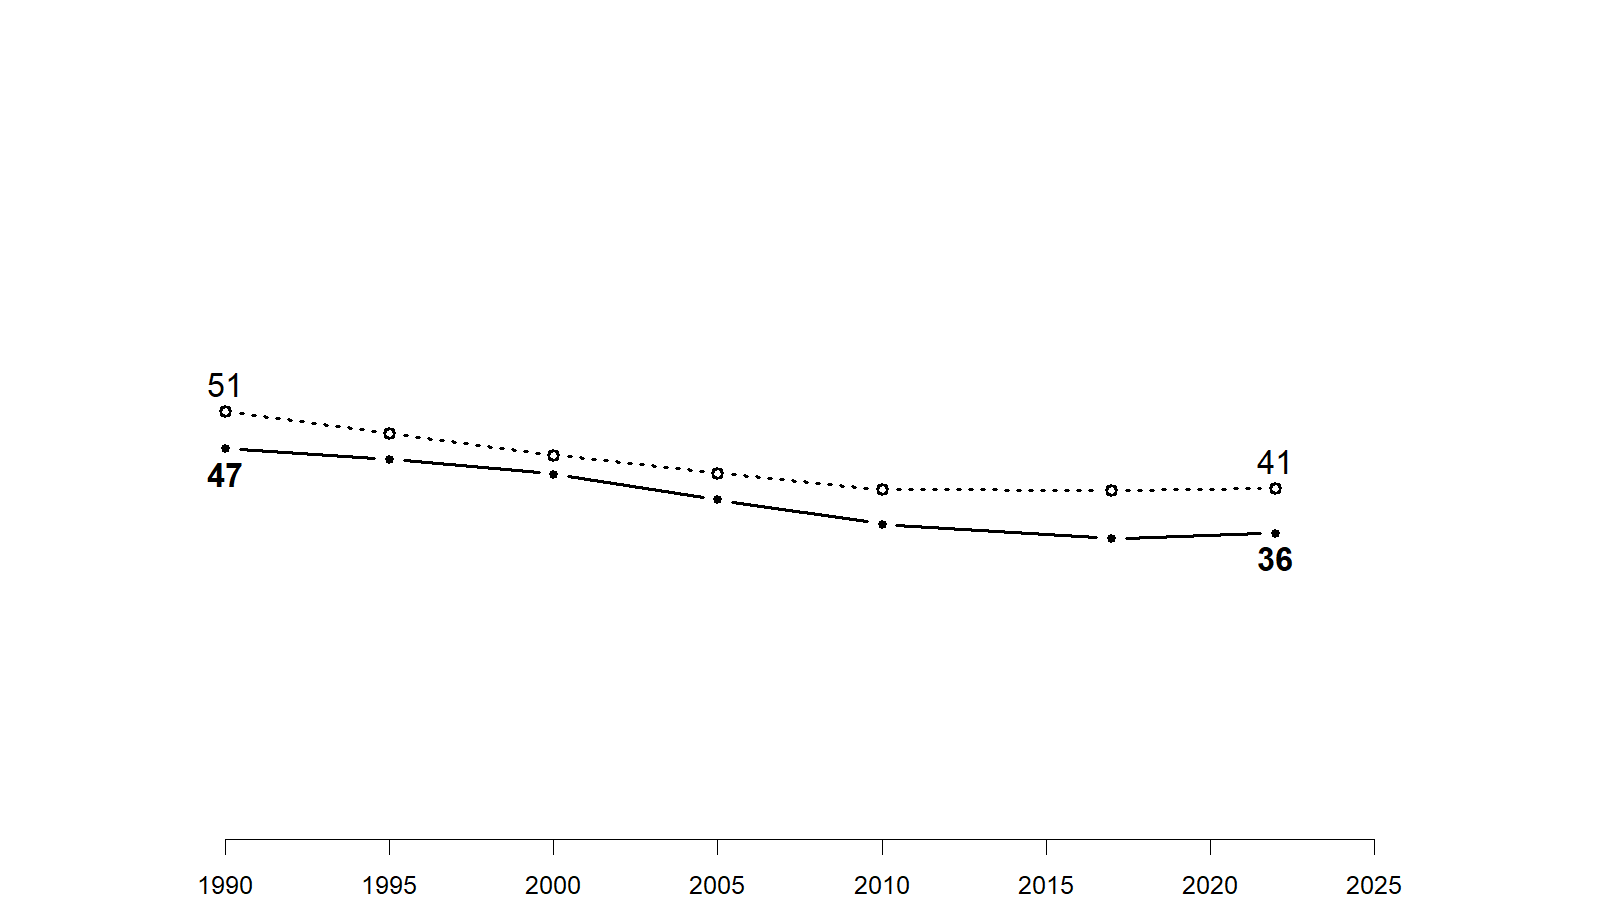
The population of the fourth district is somewhat older on average than the remainder of the state. The difference between the fourth district and other parts of the state has remained basically constant during the period between 1990 and today.
Development
Land cover, 1985-2024
The fourth district is mostly composed of eastern plains. The populated regions in the district have substantially increased their development during this period mostly at the expense of farmland and other cultivated areas.
Politics
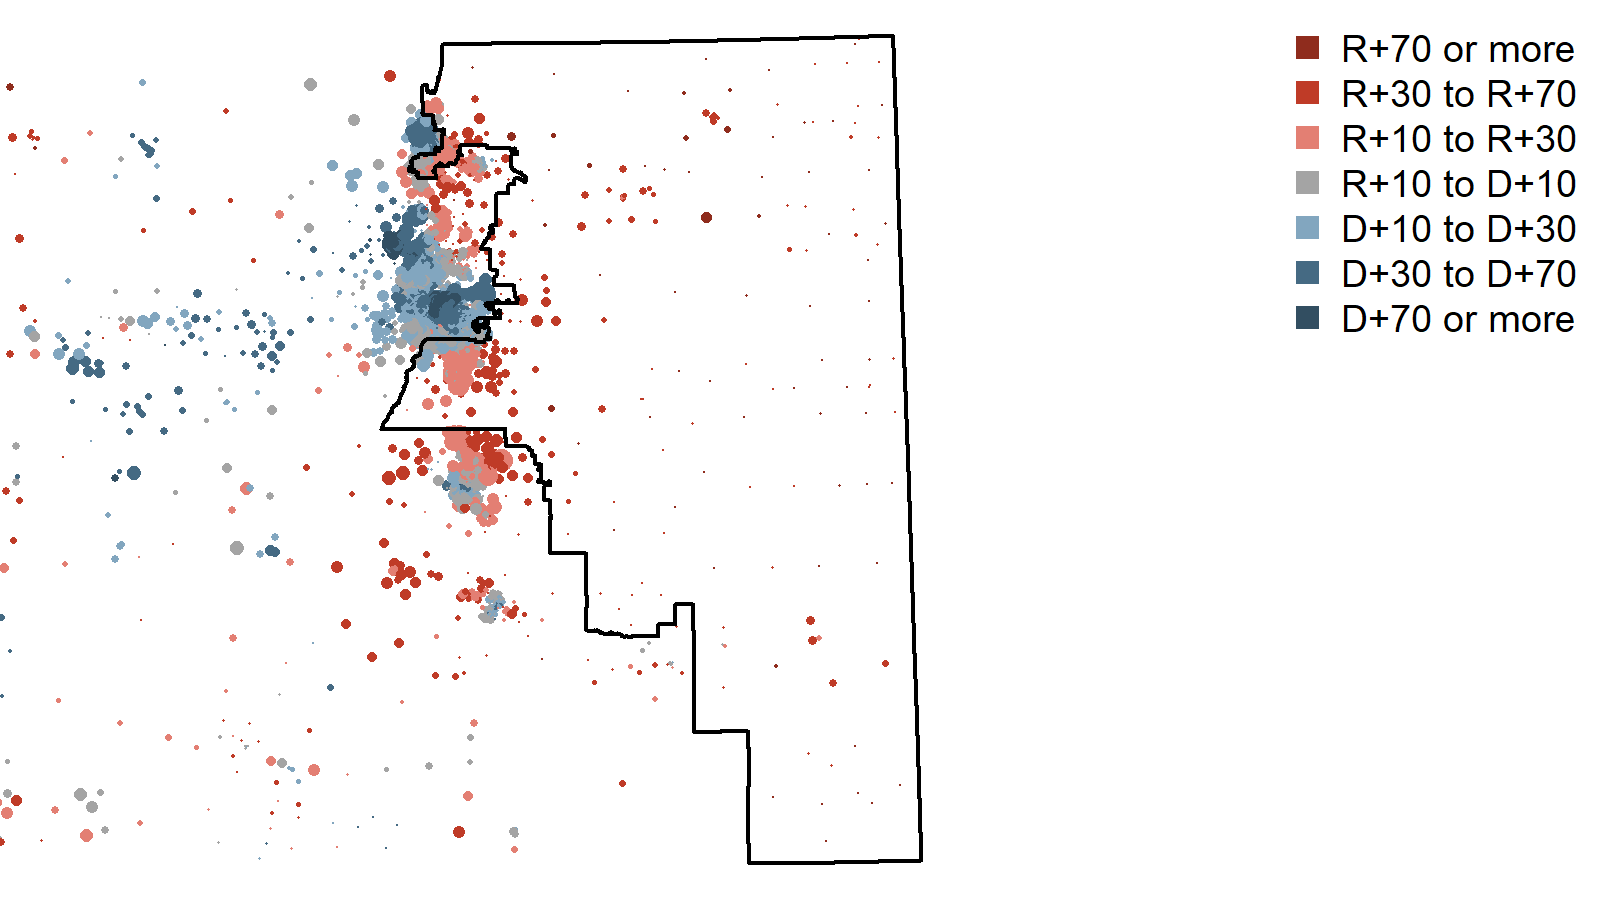
The fourth district is the most Republican district in its voting patterns in the state. In the 2024 election, nearly 60 percent of voters in the district supported Trump compared to 43% support statewide. The most Democratic areas are in the larger cities with the rural areas providing Republicans with their biggest margins.
The relationship between educational attainment and 2024 Democratic vote
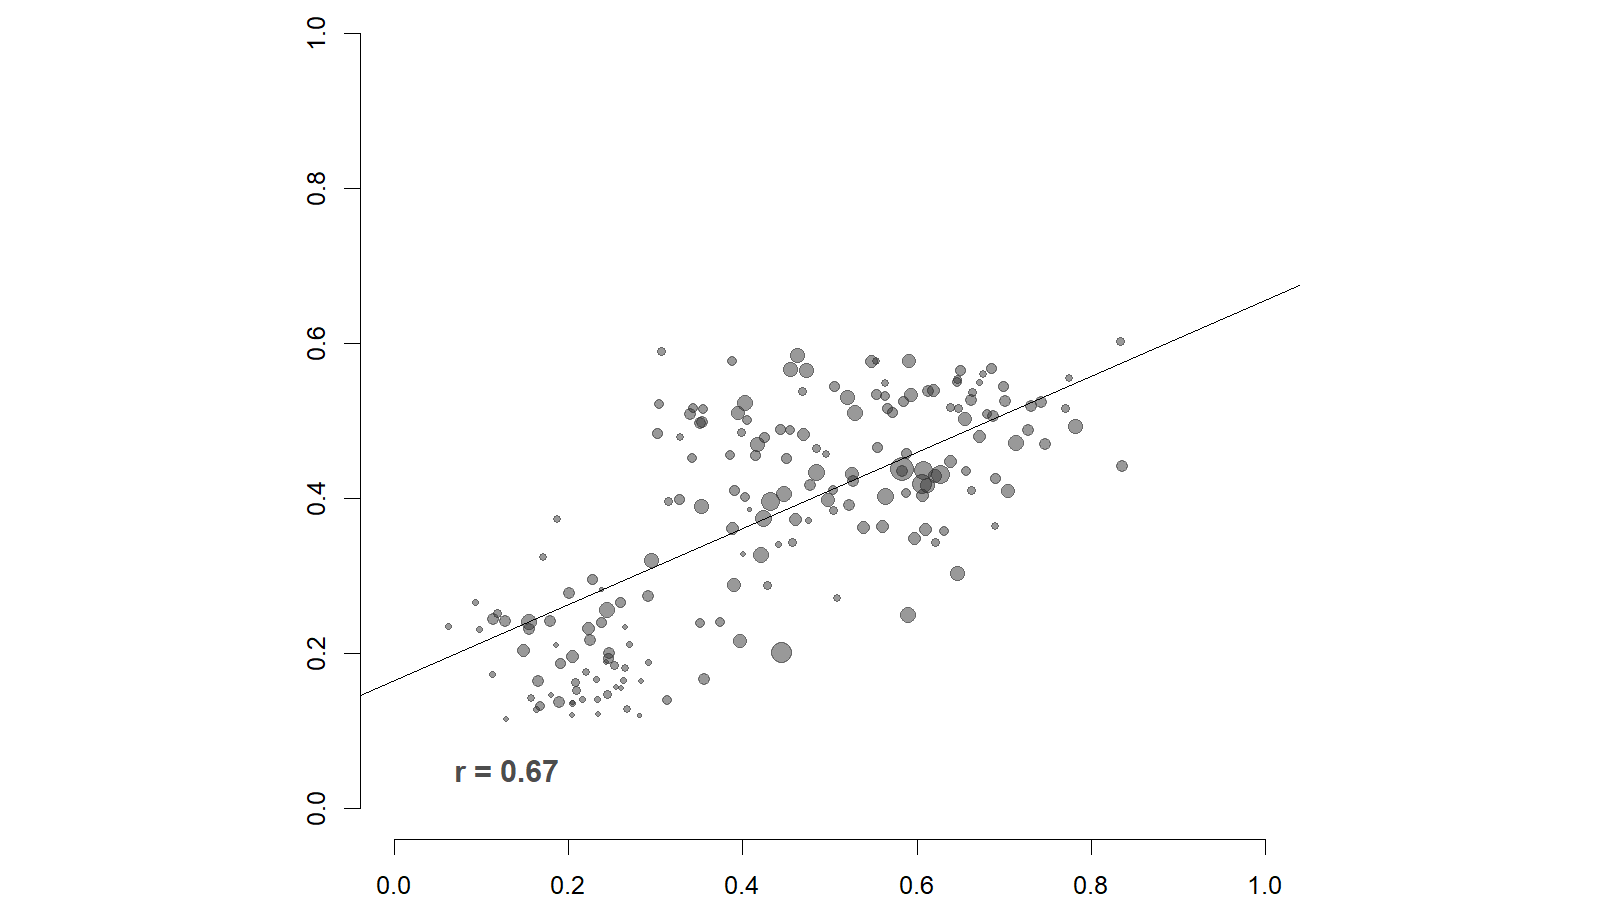
The areas within the fourth district with the highest rates of college graduates were most likely to support Harris in 2024.
Click here for a listing of fact sheets for the other districts in the state.