Colorado’s 3rd Congressional District: Fact Sheet

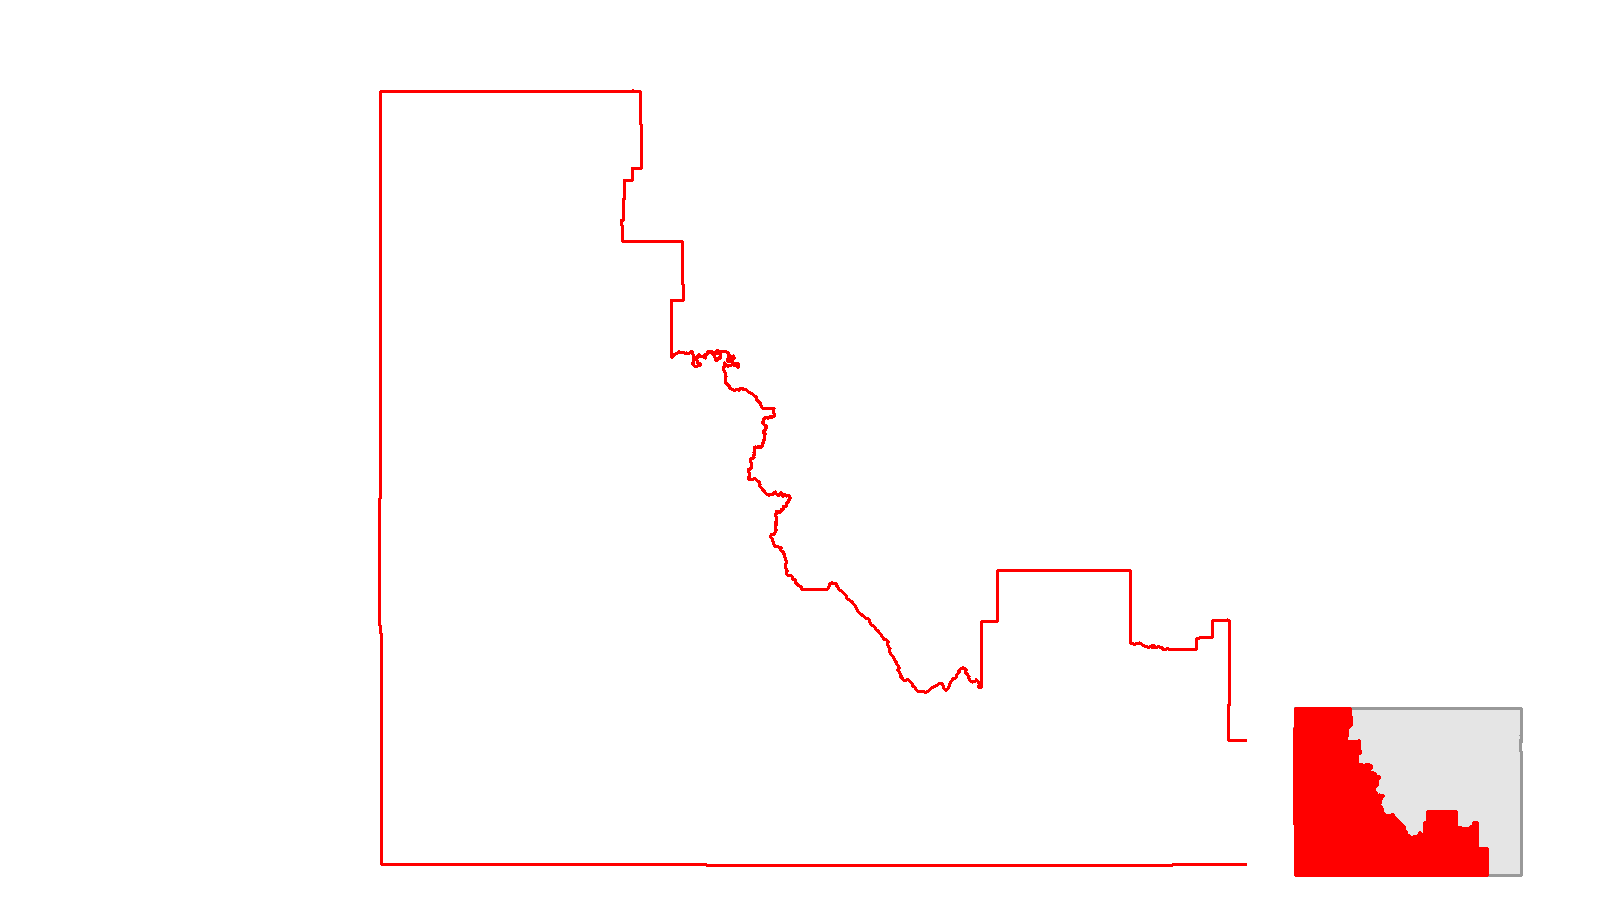
Colorado’s third district makes up most of the western and southern parts of the state. A large share of the land area of the third district is composed of mountainous regions. The largest cities in the district are Grand Junction and Pueblo. The district has been represented by Jeff Hurd since 2025.
Demographics
Population growth, 1990-2022
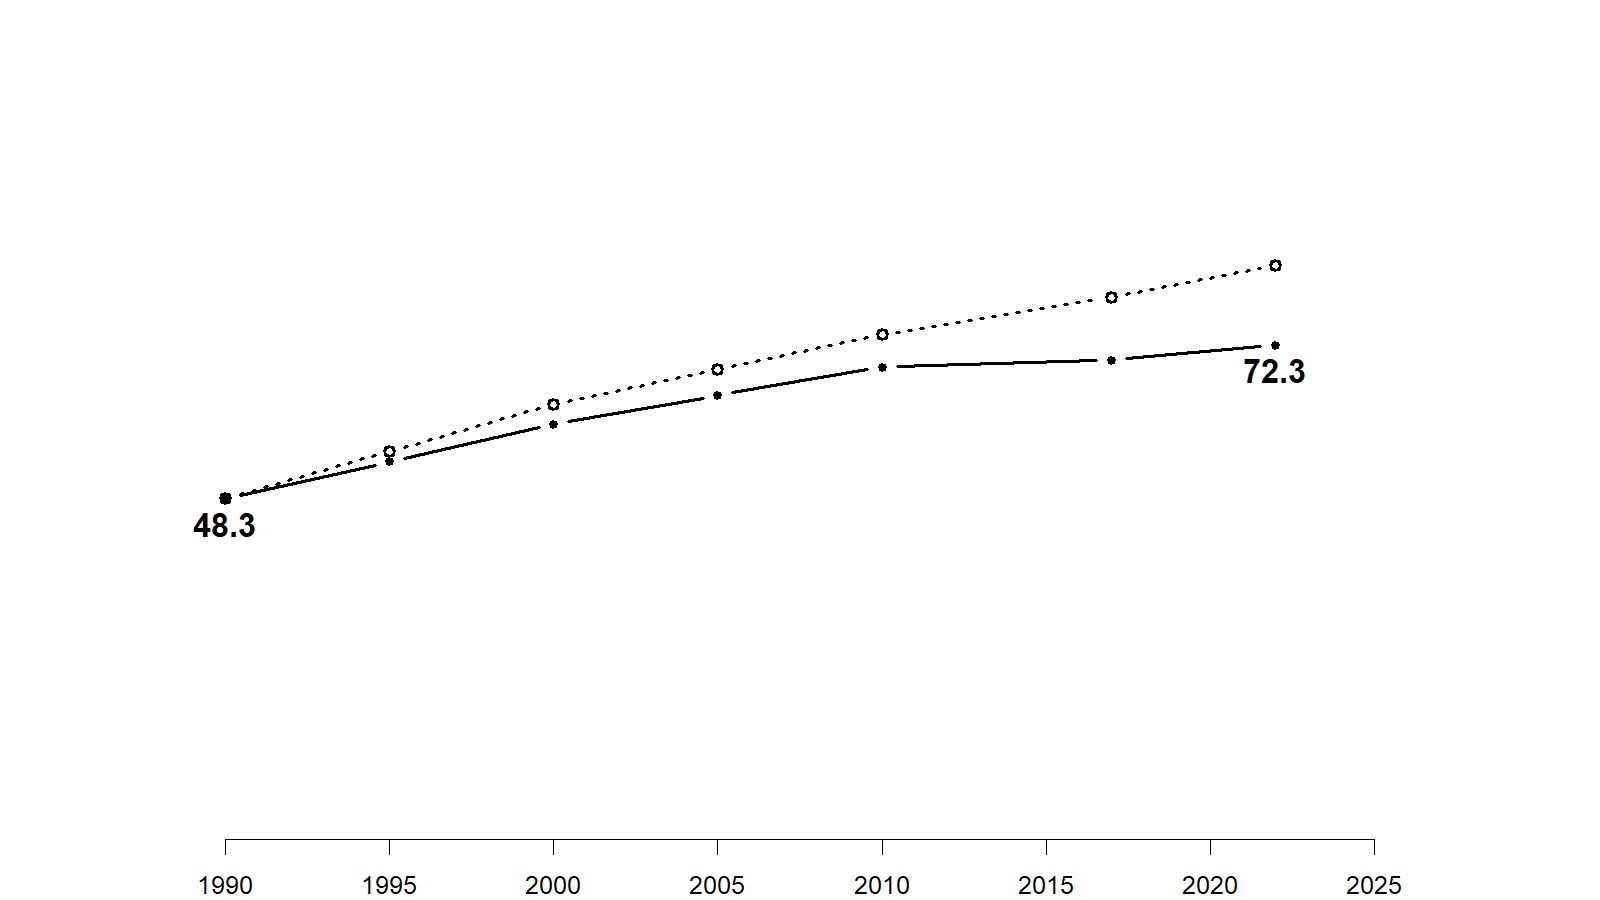
Since 1990, Colorado's population has grown by over 75%. Population growth in the area covered by the third district has increased at a slower pace growing by about 50% over this period.
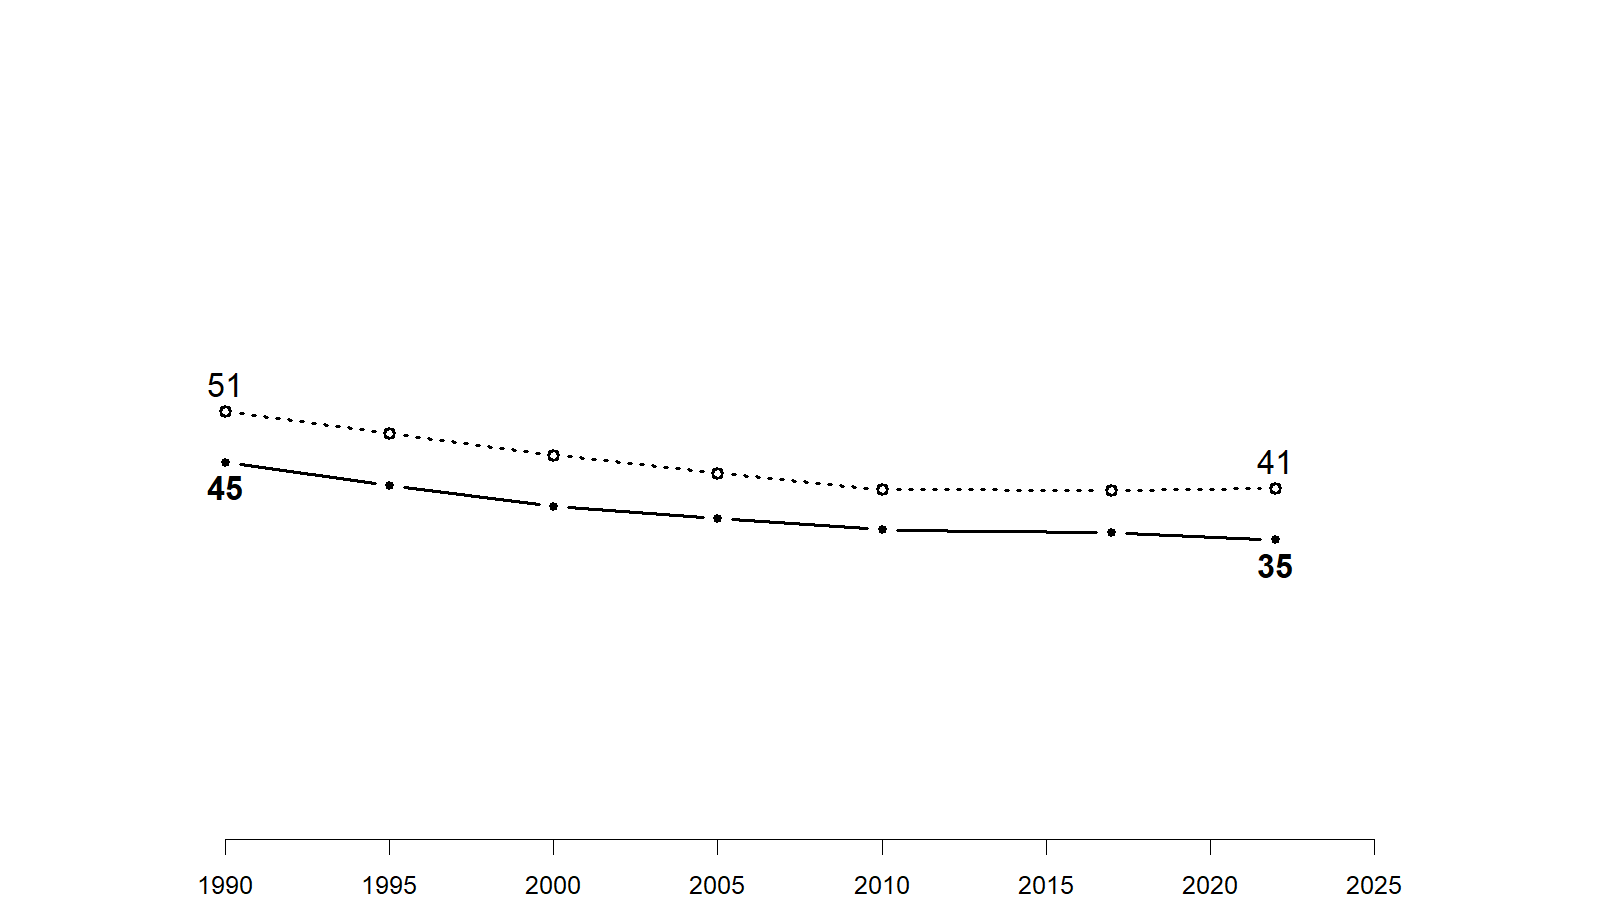
Share of the population that is White (non-Hispanic), 1990-2022
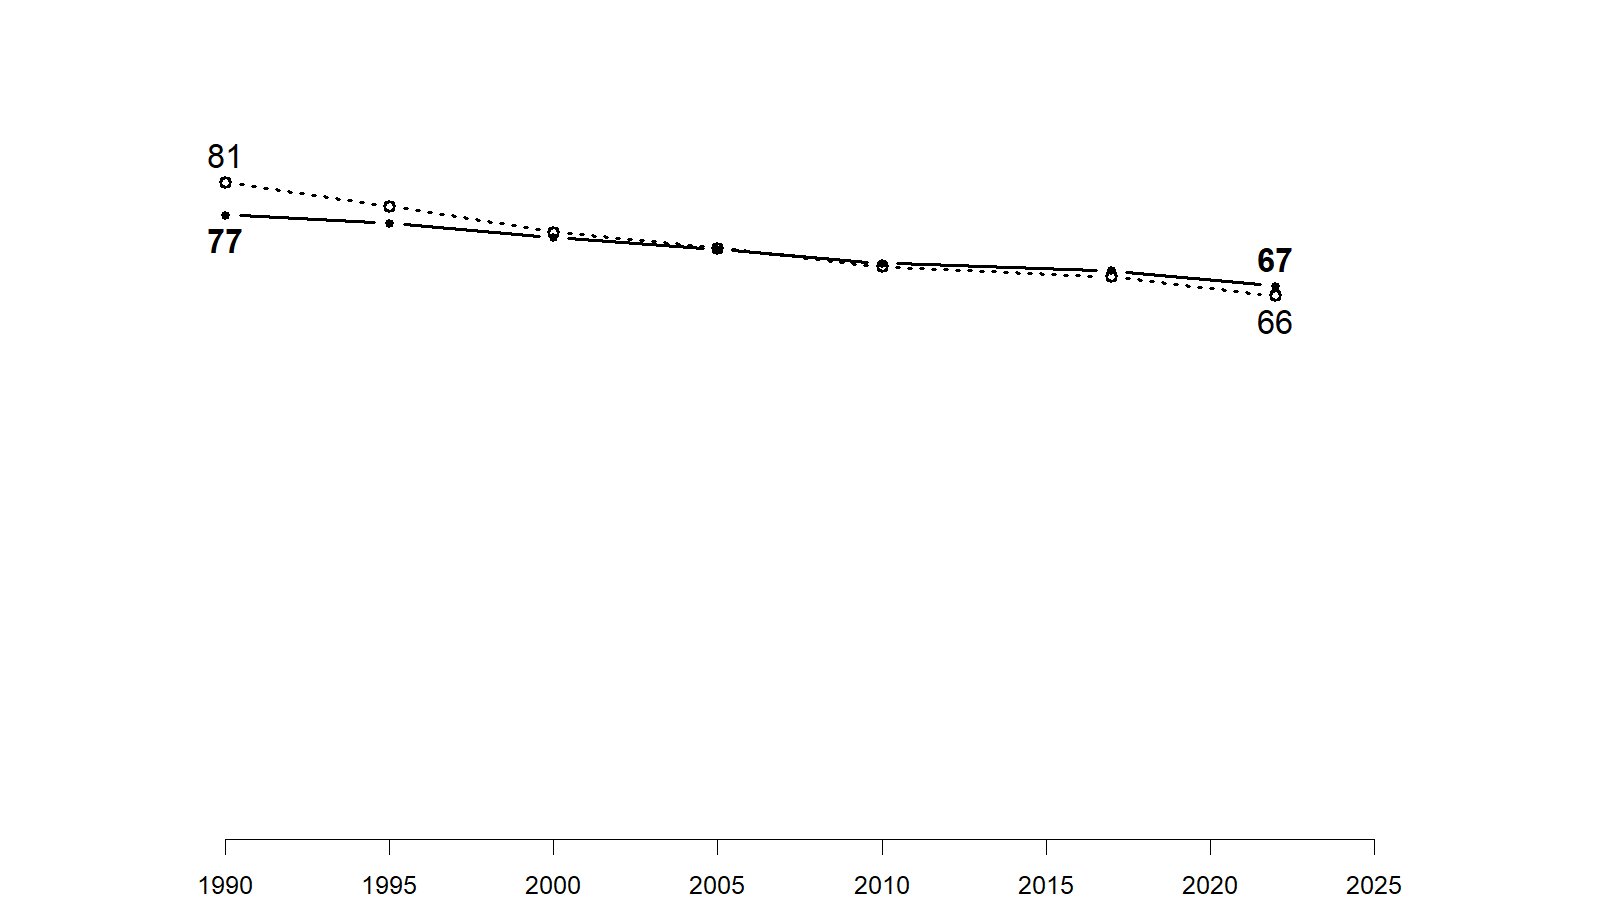
In 1990, the population in this area was somewhat more diverse than the state as a whole. Today, the share of the third district that is non-Hispanic White closely matches the statewide total.
Share of the population that is Hispanic (of any race), 1990-2022
During the past 35 years, the third district has been home to a greater share of Hispanic people than the rest of the state. While the Hispanic population in this area has grown over this period, it hasn't grown on pace with trends in the rest of the state.
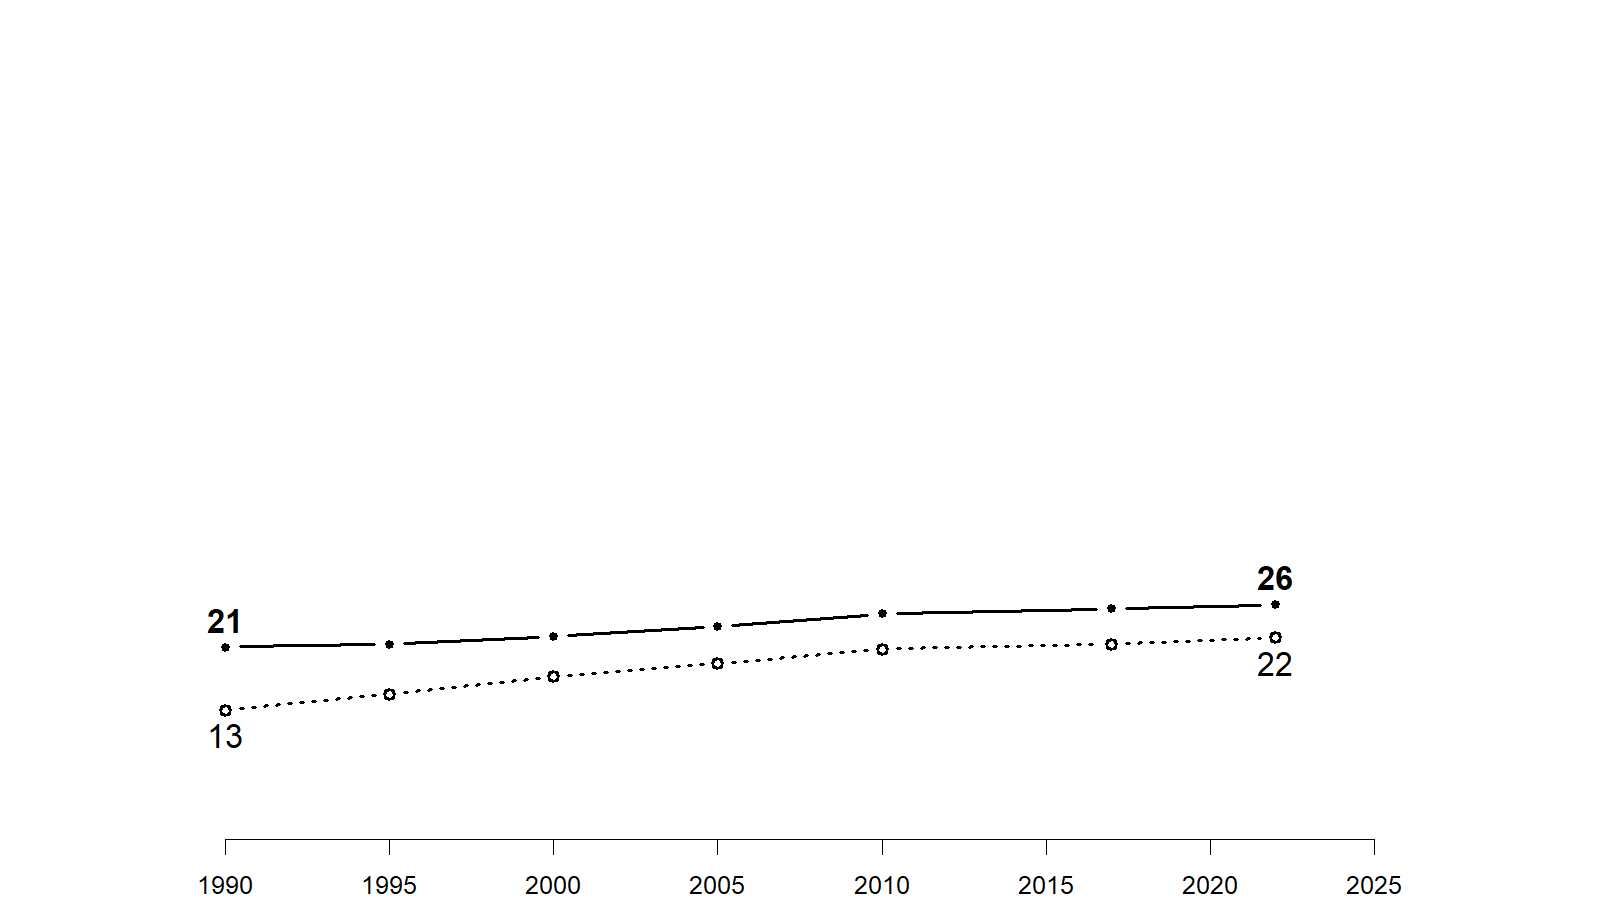
Share of the adult population that is under 40, 1990-2022
The population of the third district is somewhat older on average than the remainder of the state. The difference between the third district and other parts of the state has remained basically constant during the period between 1990 and today.
Development
Land cover, 1985-2024
The third district is mostly composed of mountainous parts of the state. The populated regions in the district have substantially increased their development during this period mostly at the expense of farmland and other cultivated areas.
Politics
The third district is substantially more Republican in its voting patterns than the rest of the state. In the 2024 election, substantially more than half of the district supported Trump compared to 43% support statewide. The most Democratic areas are in the larger cities with the rural areas providing Republicans with their biggest margins.
The relationship between educational attainment and 2024 Democratic vote
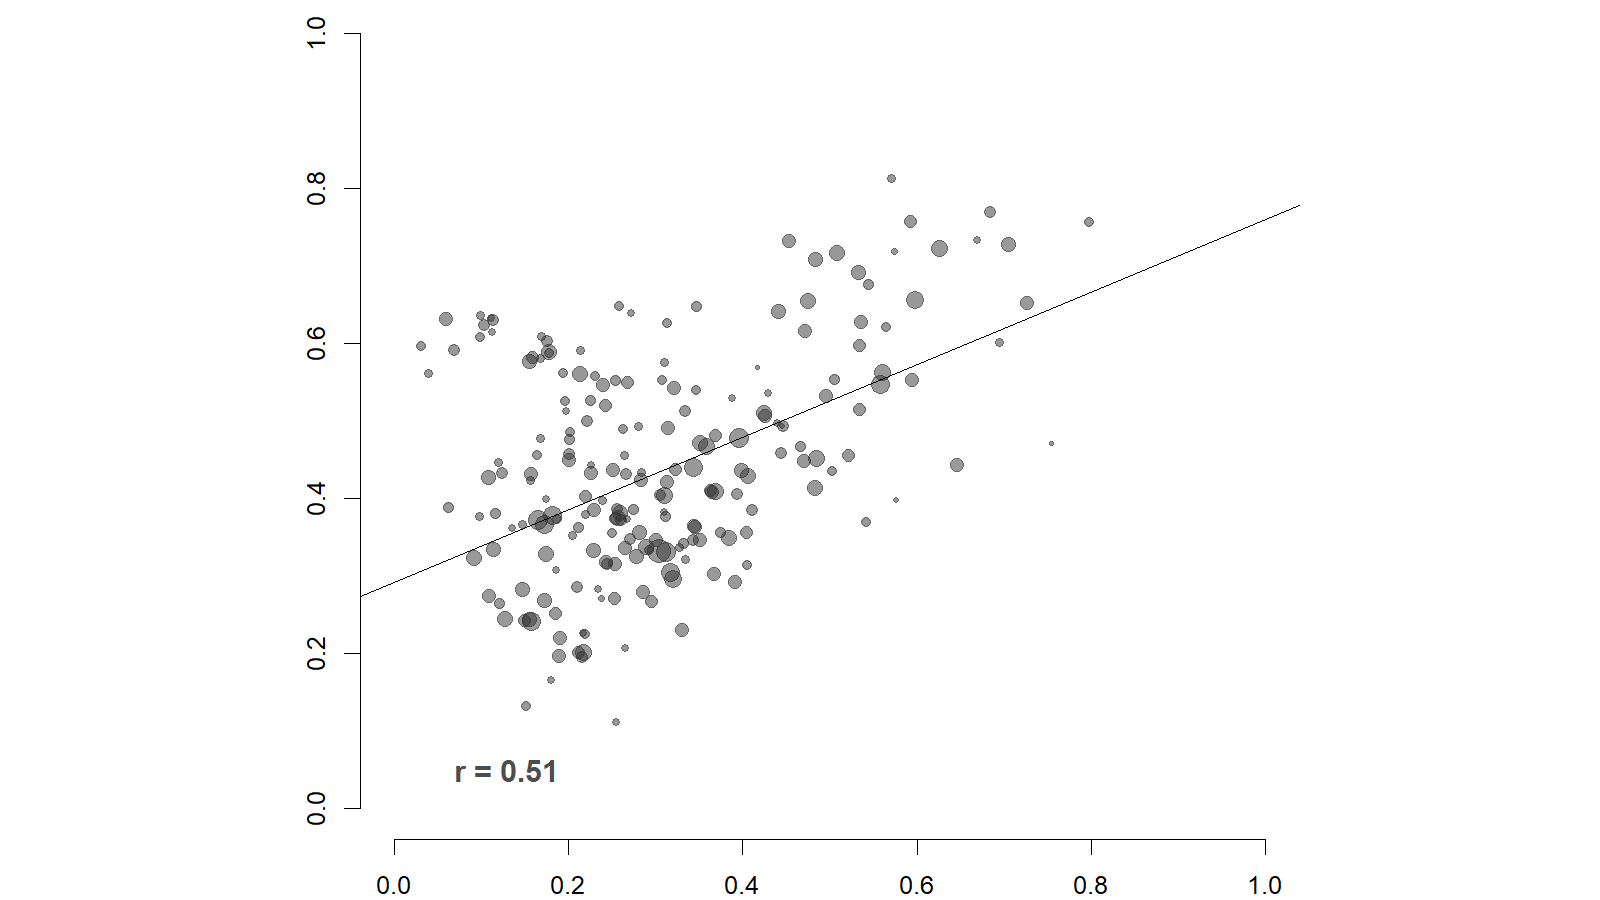
The areas within the third district with the highest rates of college graduates were most likely to support Harris in 2024.
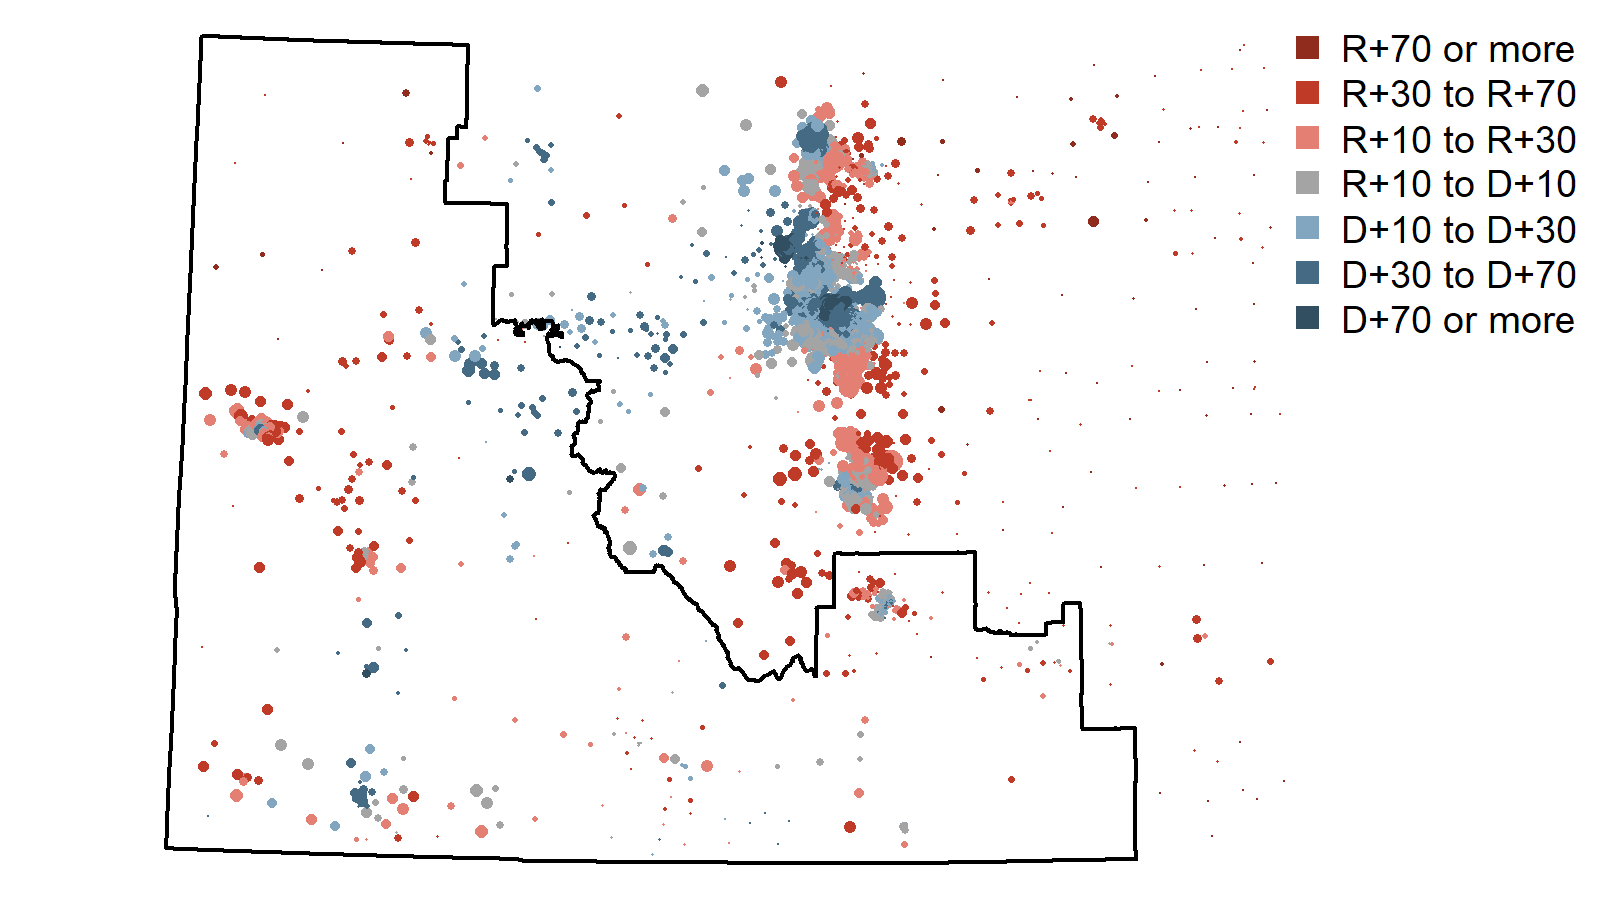
The relationship between racial composition and 2024 Democratic vote
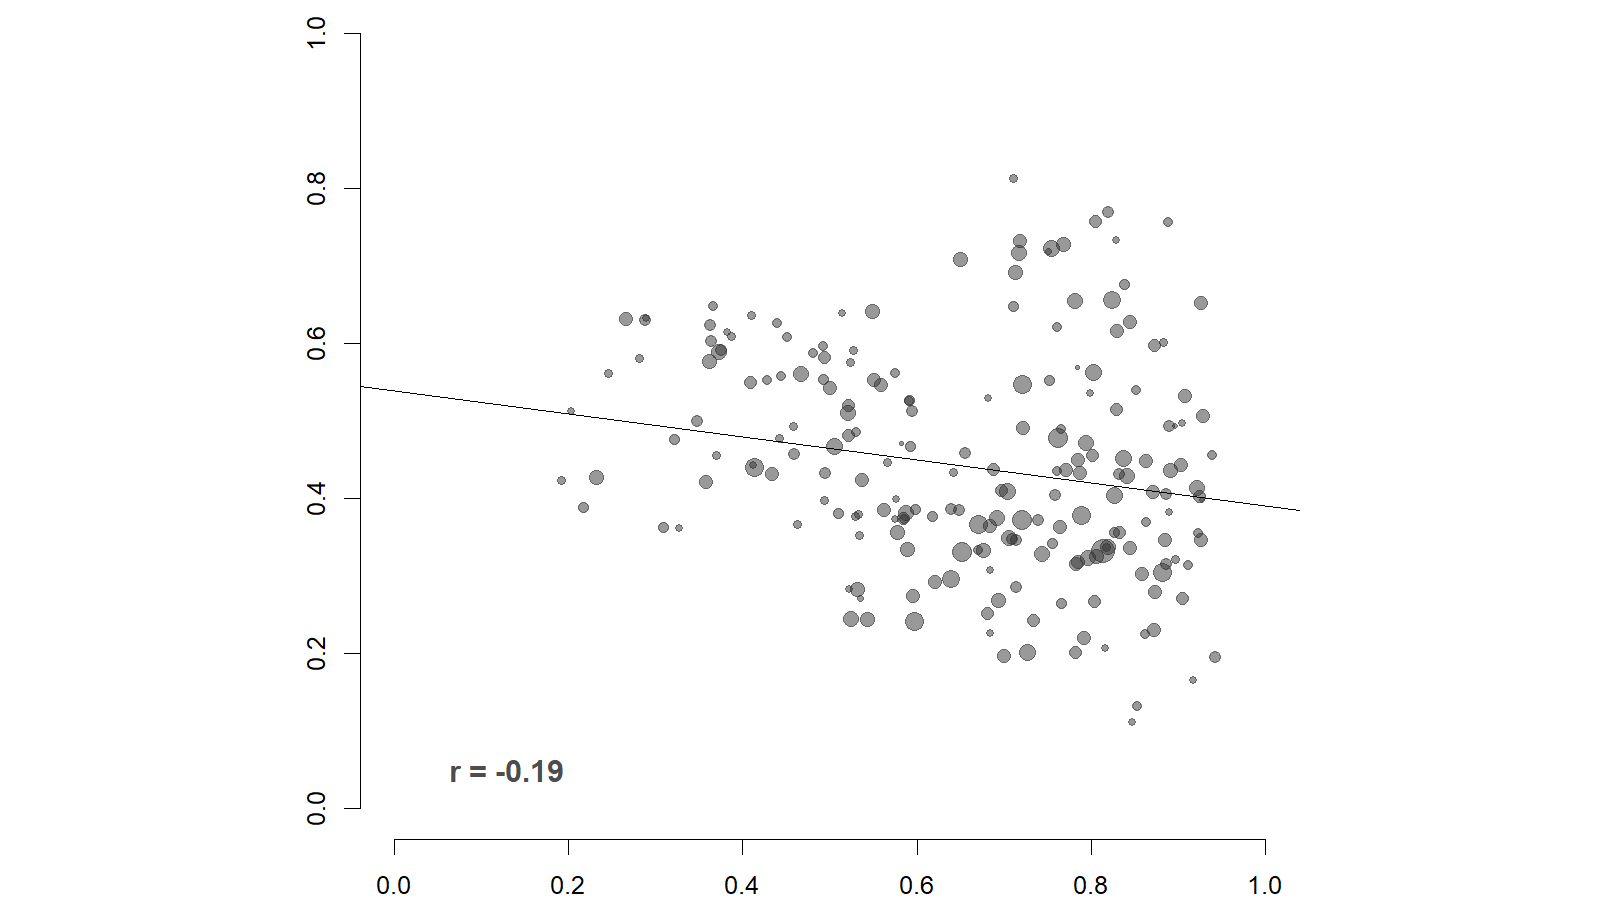
Within the third district, racial and ethnic composition is only modestly related to vote outcomes. On average, the parts of the district with the greatest shares of non-Hispanic White people were more likely to support Trump compared to other parts of the district. However when we look at Census tracts that have 80% or more non-Hispanic White people, we see some that supported Harris by more than 50 percentage points and some that supported Trump by more than 50 percentage points.
Click here for a listing of fact sheets for the other districts in the state.