2026 election predictions (part 2)
Democrats are poised to do very well in the November state legislative elections across the state.


Last time, I gave my predictions for the statewide and federal offices that are up for election in November. In this post, I'll use a little more data to build up a prediction for the state legislature.
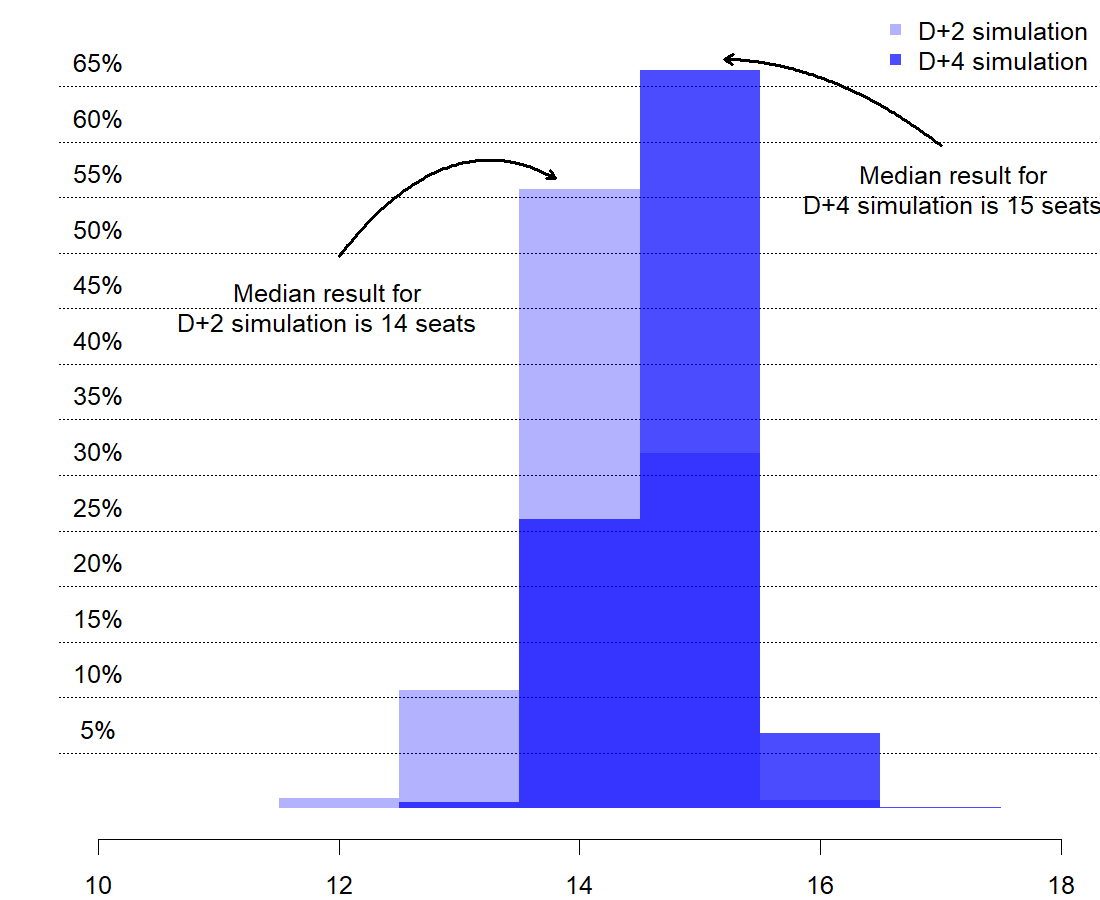
My expectation is that Democrats will win 47 seats in the lower chamber (slightly expanding their majority) from 43 seats at the beginning of the 2025 term. It wouldn't be totally surprising to see as many as 50 Democratic seats based on the analysis below (and some assumptions about the national environment). In the state senate, I expect Democrats to win 15 of the 20 races.
State House elections
If we use the past as our guide, the results of state legislative elections are very closely related to the partisan breakdown of each district (as measured by the share of the district that voted for the Democratic candidate for president). The graphic below shows this relationship with data going back to 2012.
The relationship between presidential vote and state legislative vote, 2012-2024
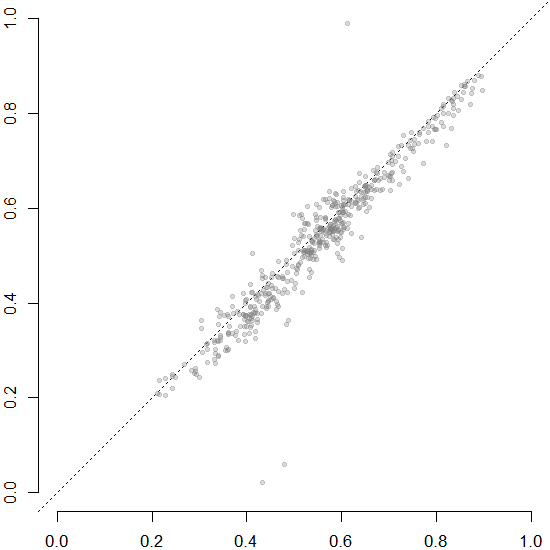
The diagonal line on the plot above shows where we would expect each district result to fall if the margins for the state legislative race were exactly the same as the presidential vote in that district. One perhaps surprising thing about looking at the data this way is how often Republican candidates outperform the presidential results in their district (e.g. most of the points fall beneath the diagonal line). This is often not enough to matter for the outcome of the race (though in several cases it is).
If we look at the differences between a district's vote for the Democratic presidential candidate and its support for the Democratic state legislative candidate, we can see the relationship between national political conditions and state legislative election results. The plot below shows the distribution of the differences between the Democratic state legislative vote and the Democratic presidential vote in each district. In every year except 2018, Republicans in the state legislature have overperformed on average.
Shifts in state legislative performance mirror national trends, 2012-2024
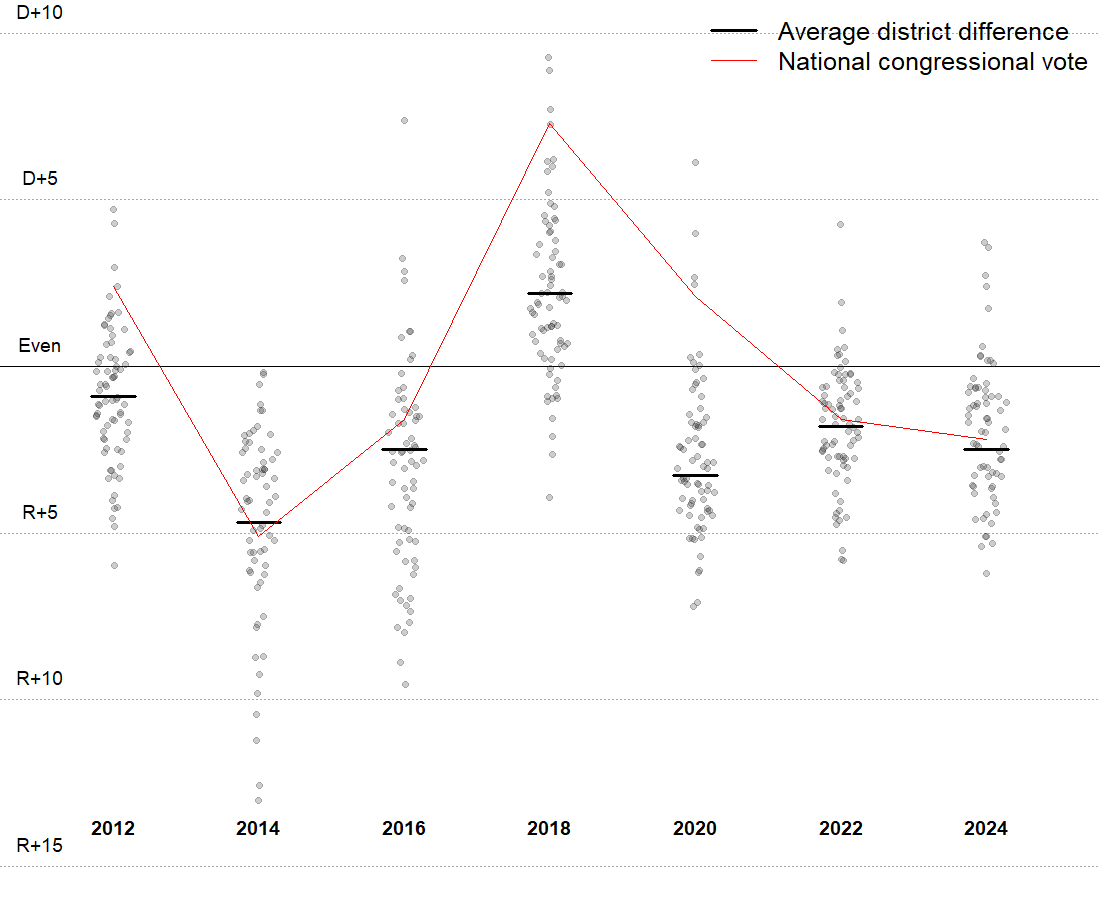
The red line superimposed on the district divergence data shows the Democratic advantage in the national congressional vote in each year. In general, the shifts in the national environment correspond to shifts in the performance of state legislative candidates. The relationship isn't perfect, and it should be kept in mind that we have only seven data points to work from (an unavoidable problem when it comes to election forecasts), but there is at least some reason to believe that a good year for Democrats nationally will translate to a good year for Democratic state legislative candidates.
State House elections
Several of the races for the lower chamber are uncontested. Out of the 65 seats up for reelection, 12 do not have a Republican challenger and 5 do not have a Democratic challenger. In total, this represents more than a quarter of all seats in the lower chamber. Of these districts almost all are very lopsided in terms of their partisanship, but there are a few potentially lost opportunities. For example, HD-58 has no Democratic challenger, but Harris received 45% of the vote in this district. Republicans didn't put up a challenger in HD-43 where Trump received 46% of the vote in 2024.
Of the 48 remaining contested seats, 18 are in uncompetitive Democratic districts where Harris won the district by 20 points or more and 5 are in uncompetitive Republican districts that Trump carried by similar margins. This leaves 25 contested races in districts that are more evenly divided. Most of these districts (14) have a Democratic leaning and 8 have a Republican leaning. Two of these districts (HD-51 and -62) were almost exactly evenly divided in the 2024 election between Harris and Trump.
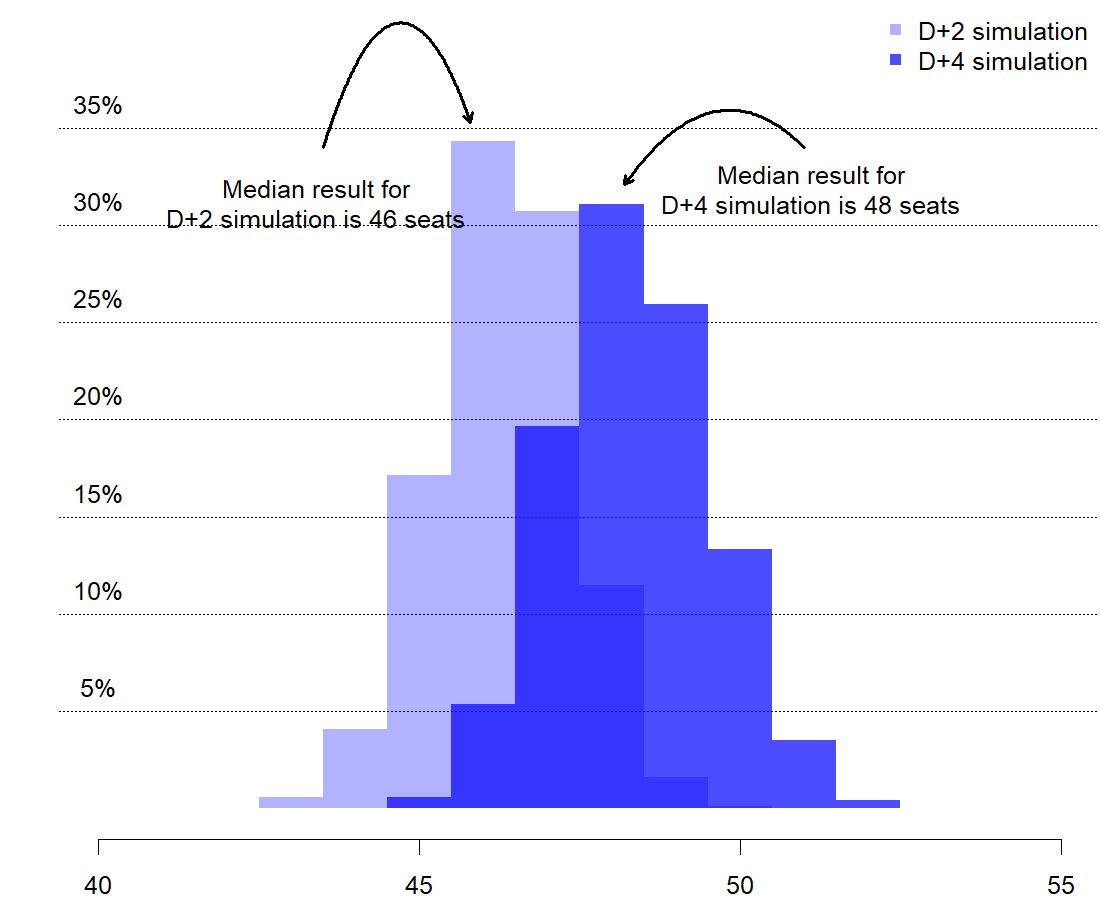
Based on only the presidential vote in the district, we would expect Democrats to have 44 seats and Republicans 21 seats. When we factor in the national environment and assume a year at least as favorable as 2018 for the Democrats (D+2 on average), the expected number of Democratic wins increases to 46. If we assume a very good year for Democrats (D+4), the prediction increases to 48 seats. The figure below shows the overall distribution of simulated outcomes in each of these two scenarios.
Simulation results for different scenarios, lower chamber
State Senate elections
We can go through a similar exercise for the state Senate. There are 20 state senate seats up for election (due to a large number of vacancies). With the exceptions of SD-7 (a heavily Republican district) and SD-31 (an even more heavily Democratic district), all of these races have both a Republican and Democratic candidate. The set of districts up for election is somewhat redder than average. The average vote for Harris across these senate districts was 52% compared to 61% for those that do not have an election this year. The smaller number of seats available and the relatively redder tint of those districts means there is less variation in the simulation outcomes.
Simulation results for different scenarios, upper chamber