Elections 2026: Early ballot data
Analysis of early voting in Colorado shows some promising signs for a very good year for Democrats in the state.


Voting has begun in earnest in Colorado. As of this writing, nearly 800,000 Coloradans have cast their votes for an election that is less than two weeks away. The pace so far this year has been substantially faster than what we saw in 2022, and is approaching levels that we saw in 2024. If these trends continue, Colorado is on pace to break records for midterm turnout (if you want to explore some of this data yourself, check out this very cool dashboard from On Point Politics).
On the limits of the data
The question of what the early vote data can tell us is a bit of a tricky one. As with many quantitative indicators, early vote totals suffer from a kind of drunkard's search problem where because it is the only data that we have, we tend to read too much into it (similar to campaign finance totals in the early days of a primary).
There are a couple of very important caveats when trying to extract some signal from early vote reports. The early vote totals can really only say two things: 1) how many people have returned their ballots; and 2) some general facts about those voters. Each of these kinds of information we learn from the early vote totals has important qualifications. The ballot total numbers are contingent on the particular collection and reporting schedules of each county elections office. Many counties collect and report ballots from drop boxes daily, but there is always going to be some delay between the reports and the number of ballots that have actually been deposited.
On the second point, the only information we can learn about these voters is what is in the voter records. We won't know anything about who or what they actually voted for until the ballots are scanned and tallied. We only know things about where they live, their ages and gender (as those are recorded in the voter file), and their stated party affiliation (which, as we've talked about, is different from their partisan identification).
Some initial results
With all of that said, let's dive into the data. Most counties in Colorado make the CE-068 report publicly available which gives a record of all ballots that have been distributed and is updated regularly as ballots are retrieved from drop boxes or cast in other ways. The file is an excerpt of the state voter file, and it includes geographic and demographic information as well as each voter's partisan registration and the date their ballot was processed. The data I have is not an exhaustive look at all 64 counties in the state. I've selected a few of the highest population counties in the state (Adams, Arapahoe, Boulder, Denver, Douglas, Jefferson, Larimer and Weld) covering about 80% of all ballots distributed (I attempted to get a similar report for El Paso County but was unable to as of this writing).
The pace of early voting
There has been a slow trickle of UOCAVA (Uniformed and Overseas Citizens Absentee Voting Act) ballots that began in September. The first non-UOCAVA ballots began being processed on October 5th. The graphic below shows the share of ballots that have been processed each day since regular absentee ballots started being counted. As of October 22, a little over 15% of all ballots that had been distributed had been processed.
Share of ballots that have been processed by day ...

Partisan differences in early voting
Democrats have turned out at higher rates than any other grouping of voters with ballots. The graphic below compares the ballot return rate for each group of voters since ballots began being processed. Registrants with each major party have returned their ballots quicker than unaffiliated voters.
It is important to remember that this data does not tell us anything about how these voters have cast their ballots just which party they were registered with when they did so. It is not unreasonable to expect that those with Democratic affiliations will tend to vote for Democrats more on average than those with Republican affiliations, but this data does not tell us that on its own.
Share of ballots that have been processed by day and partisan grouping ...

Age and gender differences
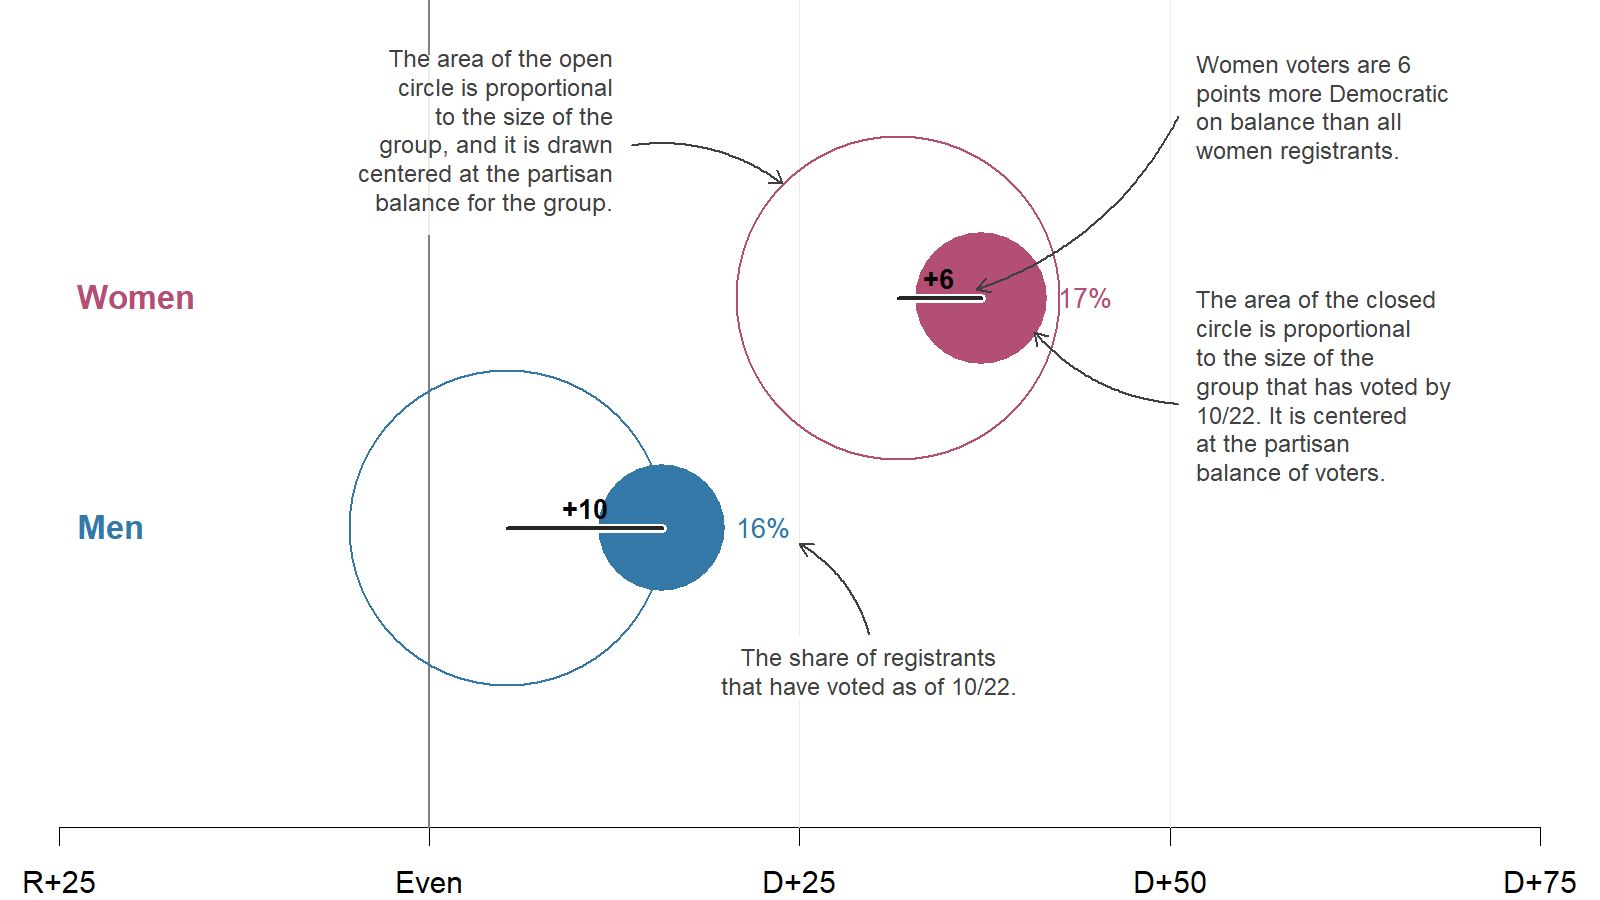
The graphics below attempt to show several things simultaneously. Each circle is drawn proportionate to the size of the group. The open circles show the total number with ballots and the closed circles show the share that have been returned and processed. The positioning of each circle on the horizontal axis is located at the overall partisan balance of the group (the share of Democrats less the share of Republicans). So, women registrants with ballots in Colorado have about a 30 point Democratic advantage (not counting those who are unaffiliated or registered with a minor party). Among the 17% of women who have returned their ballots, that Democratic advantage increases to about D+37. The shift for men is even more dramatic (though they start from a substantially lower Democratic advantage).
Partisan advantage among different groups of Coloradans by gender ...
We can layer in generation to this analysis to reveal several interesting facts about the Colorado electorate.
Partisan advantage among different groups of Coloradans by gender and generation ...
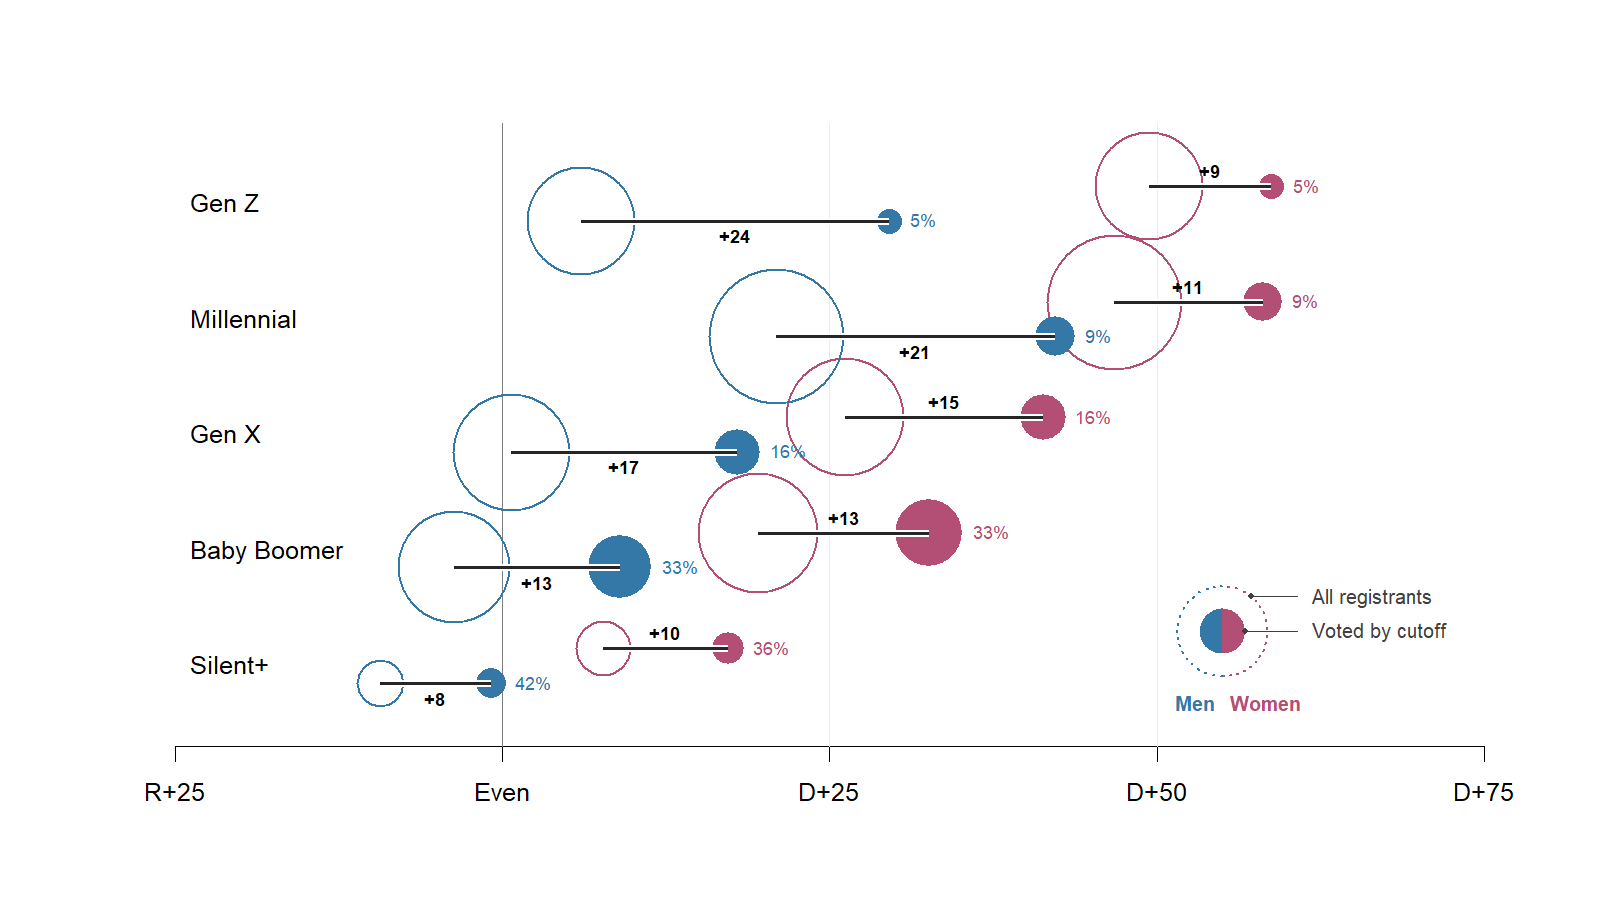
First, note the dramatic age gradient in turnout rates. Only 5% and 9% respectively of Gen Z and Millennial registrants in Colorado have returned their ballots compared to a third of Baby Boomers and even greater shares of older generations (Silent and Greatest Generation voters).
The data also show the generational divides in Colorado politics. Generational cohorts of women are consistently more Democratic in composition as they get younger. Among all registered Gen Z women, Democrats have a near 50 point advantage among those registered with a major party. This compares with about a D+8 advantage among the oldest cohorts of women registrants in Colorado.
Men mostly follow the same pattern with the exception of Millennial men who are substantially more Democratic in their orientation compared to their younger Gen Z counterparts.
Among every generational and gender grouping, the partisan balance of those who have returned their ballots is significantly more Democratic than the balance of the whole group, and with the exception of the oldest cohort of men, every grouping of voters with returned ballots is more Democratic than Republican on balance.
A note on the difference between the total figures by gender and the generational grouping: Eagle-eyed readers may be puzzled (as, honestly, I was at first) by the apparent contradiction between the total difference among women (6 points between all registrants and voters) and the generational differences (the minimum of which is 9 points). This is a kind of soft version of Simpson's paradox whereby the aggregate can show a very different pattern than subgroups due to the overall composition and sizes of the individual groupings. In this case, the relationship doesn't change sign, it is just somewhat attenuated in the overall data.