Traffic violence in Colorado, 2005-2024
Hundreds of people die every year on Colorado's roads. In many ways, Colorado is typical of the national epidemic of traffic violence. This post discusses some of the important trends and compares Colorado to the rest of the country.


Over the span of 20 years, 11,567 people were killed on Colorado roads. Traffic violence – a blanket term for injuries and deaths caused by motorized vehicles – is one of the leading causes of preventable death in the United States, and this is especially true for younger people. The figure below shows the number of killings on Colorado roads compared to the national trend.
Killings on Colorado roads and nationally, 2005-2024
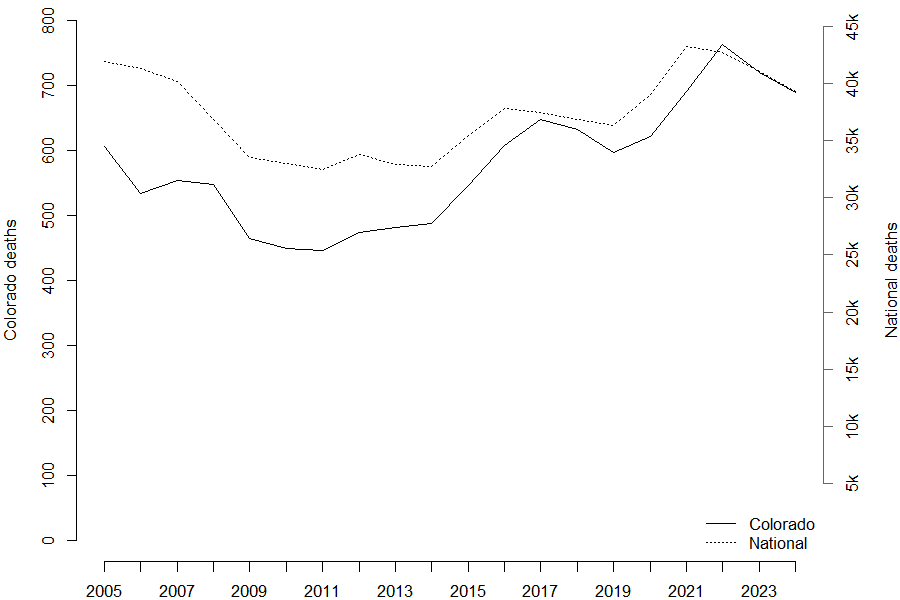
In 2024, Colorado was almost exactly in line with the national average, but for much of the two decades Colorado had somewhat fewer deaths as compared to the national average. In 2022, deaths on Colorado roads continued to increase while the national trend started to reverse, and since that time, the population adjusted numbers for traffic killings in Colorado has matched the national average.
About the term “traffic violence”
Throughout this post, I will refer to killings caused by cars, trucks and other motorized vehicles as traffic violence. As others have noted, the language that we use to describe these killings often subtly (or not so subtly) shifts the locus of responsibility for these deaths to the victims or isolated and idiosyncratic behavior of drivers rather than the systems that that make it possible for tens of thousands of Americans to be killed every year.
A note about the data used in this post
This post will rely primarily on data from the FARS (Fatality Analysis Reporting System) collected by the National Highway Transportation Safety Administration (NHTSA). This data is meant to record all crashes in the United States “involv[ing] a motor vehicle traveling on a trafficway customarily open to the public and … result[ing] in a death of a motorist or a non-motorist within 30 days of the crash.” By some estimates, the grim accounting of FARS will exclude 2,000-4,000 deaths among primarily children that happen in parking lots or so-called “backover” killings in private driveways, and of course the focus is narrowly on the direct killings of caused by cars rather than the many ways in which cars indirectly harm people through air pollution, lifestyle changes and the opportunity costs incurred by the trillions of dollars spent on car-centric infrastructure that might have been spent in other ways.
A few of the important numbers
Bicycles and pedestrians are the most vulnerable people on the roads, and the share of deaths among those not in cars as a share of the total killings on roads about doubled over the span of 20 years. The figure below shows how the share of pedestrian and cyclist killings has risen over this period. Even during the first part of the timeseries when overall traffic killings were falling, the share of pedestrian deaths continued to rise.
Killings of pedestrians and cyclists as a share of total, 2005-2024
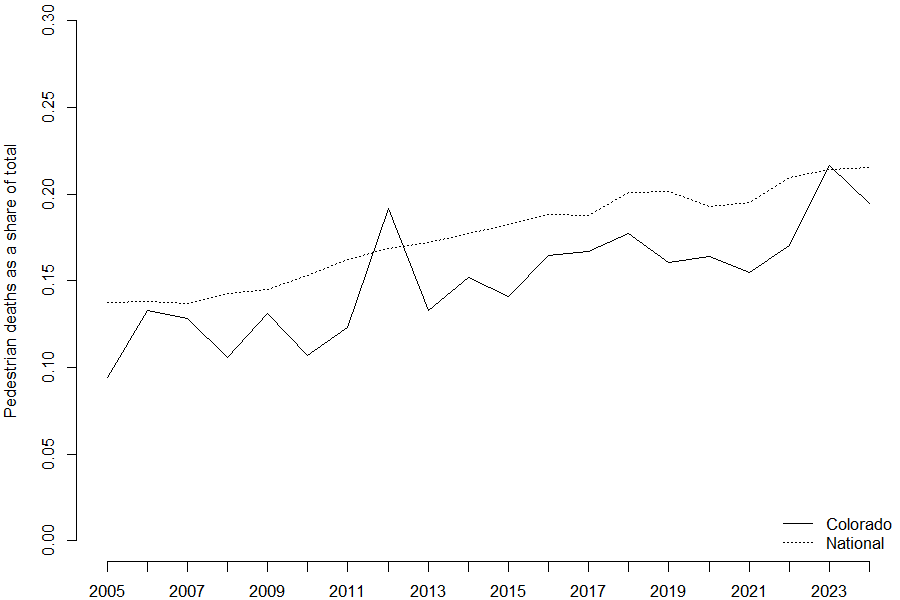
In general, pedestrians and cyclists have made up a somewhat smaller share of overall killings in Colorado compared to the rest of the country, but the trends have basically been moving in parallel.
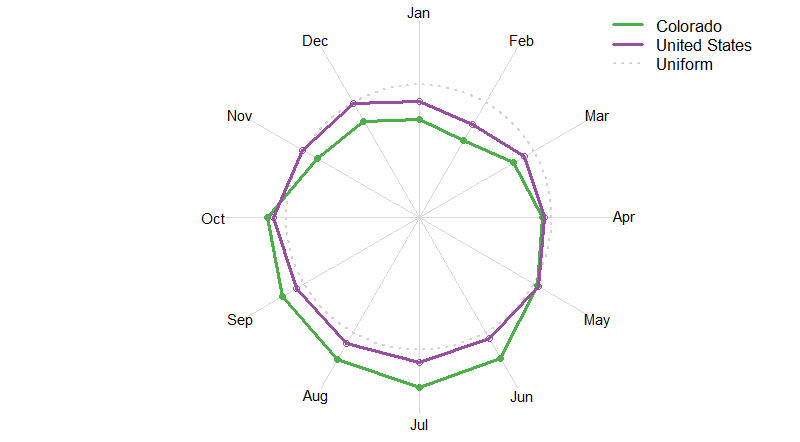
Colorado shows a stronger seasonal pattern in traffic violence. Contrary to what some might expect, the winter months in Colorado are actually among the least deadly on the roads. To a greater extent than the pattern nationally, deaths on Colorado roads are most likely to occur in the summary months. The plot below shows the share of traffic killings that occur in each month. If deaths were evenly distributed over the year, each point would fall along the dotted line.
The distribution of deaths over the year, 2005-2024 average