Rising temperatures in Colorado over the last 75 years


In my last post, I (perhaps unadvisedly) wandered out of my comfort zone and into some climatological data in the form of snowpack data over the past 40 years in Colorado. While I wait on some official election data to come in, I've got another dataset in the same general area to look at: temperatures. There is overwhelming evidence that global temperatures have been rising over the past two centuries. Is that pattern any different in Colorado compared to the rest of the country?
About the data in this post
The data in this post comes from the National Centers for Environmental Information (under the purview of the National Oceanic and Atmospheric Administration). The NCEI publishes daily temperature data for the United States going back to 1951. The data comes from weather stations around the country and is available as county-level estimates. For this post, I'll be looking at the daily average temperature measures (rather than the maximum or minimum). I've used a 30-year period (from 1961 to 1990) to come up with a baseline estimate of daily temperature. This choice of baseline is a standard choice among climatologists. The daily baseline estimates are further smoothed by looking at a window of +/- 5 days to determine the baseline daily temperature. For example, to find the June 5th baseline temperature, we would look at the average temperatures between May 31st and June 10th between 1961 and 1990. When making comparisons to the rest of the country, I only consider the continental United States.
An overview of Colorado temperatures
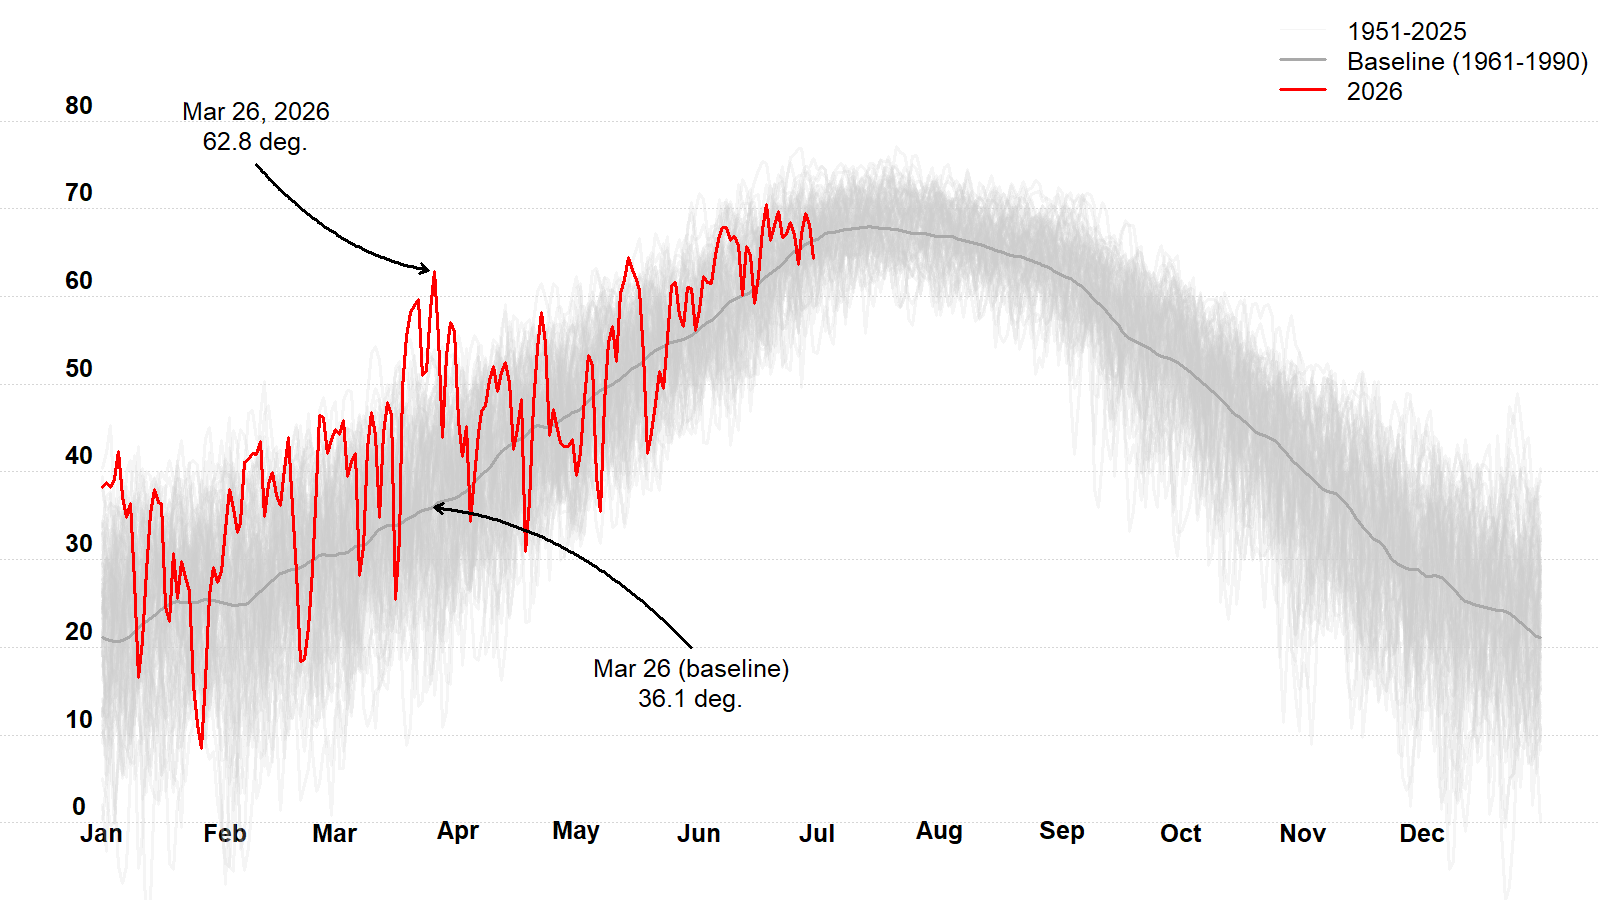
The graphic below shows the past 75 years of temperature data as well as the baseline estimate of temperature in Colorado. The red line shows 2026 up through June 30. So far in 2026, over half of days (52%) have been 5 degrees or more above the baseline temperature. This is nearly 10 percentage points more than the nationwide number (as of June 30, 43% of days nationally have been 5 degrees or more above the national baseline). The graphic also shows the much warmer than average temperatures in March of this year (which surely contributed to the earlier than usual melting of the meager snowpack Colorado received this past winter).
Average daily temperatures in Colorado, 1951-2026
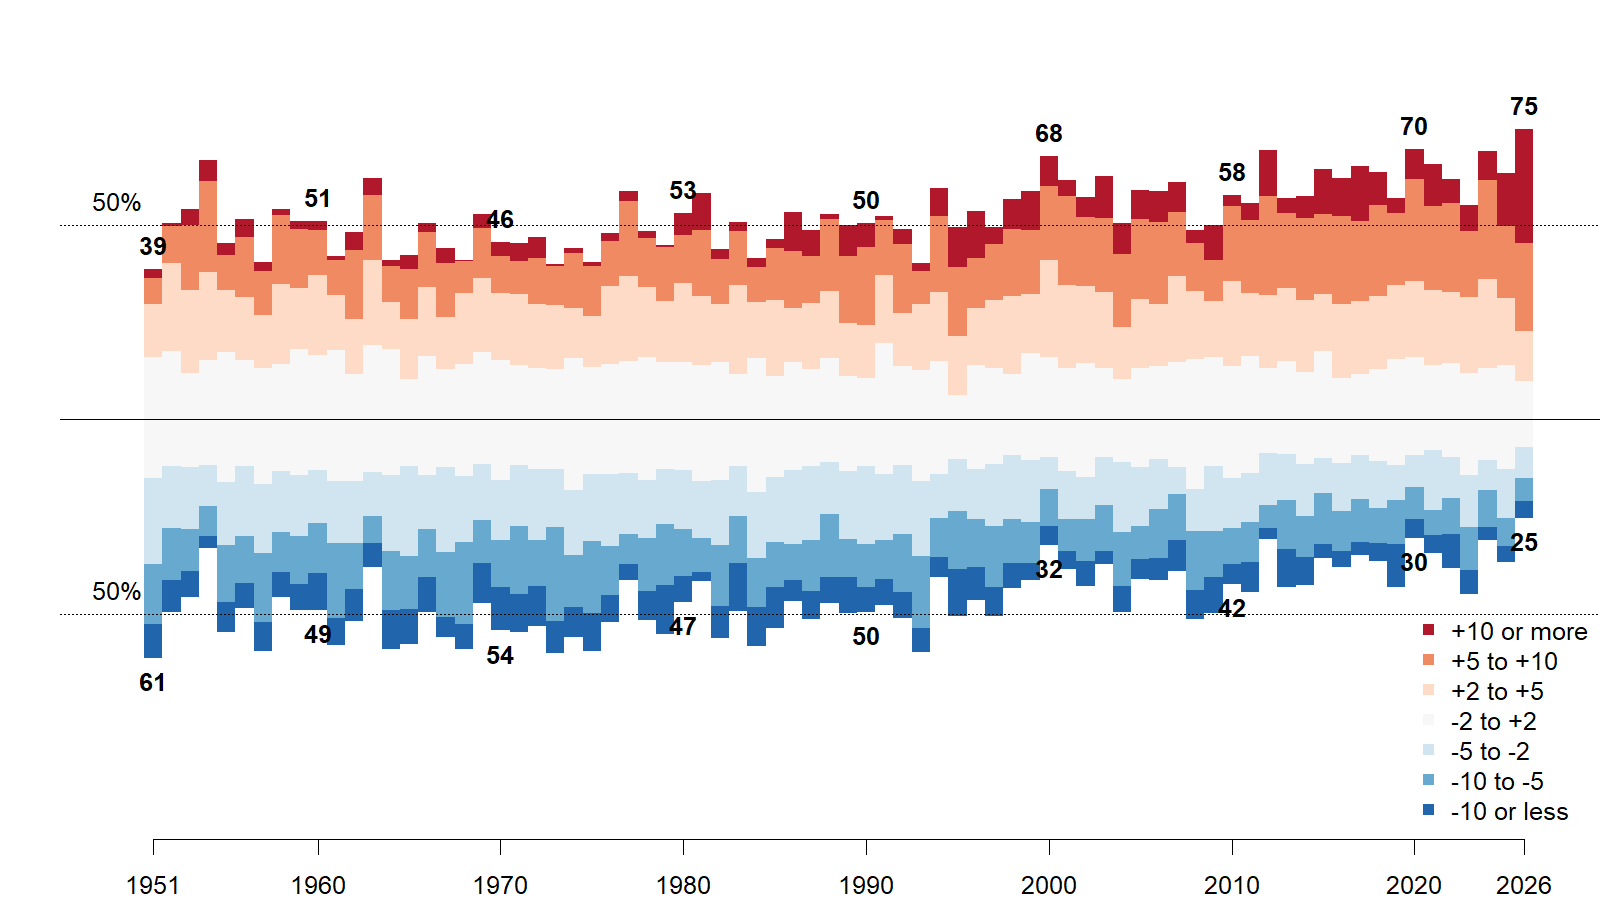
Another way to visualize this data is in terms of deviations from the baseline temperature. In the plot below, I show the difference between each day's temperature and the baseline reference. Positive values indicate days that are warmer than expected, negative values indicate days that are cooler than expected.
In the early part of the timeseries, the temperature deviations were about equally likely to be colder than the baseline as they were to be warmer than the baseline. By the late 1990s and early 2000s, it wasn't uncommon to see years where 60% or more of the days were warmer than the baseline. Seventy percent of days in 2020 were warmer than the baseline. So far this year, 75% of days have been warmer than the baseline.
Temperature deviations by year in Colorado, 1951-2026
How does Colorado compare to the rest of the country?
Using the same methodology, we can look at temperature deviations in the continental United States overall. The graphic below shows the results.
National temperature deviations by year, 1951-2026
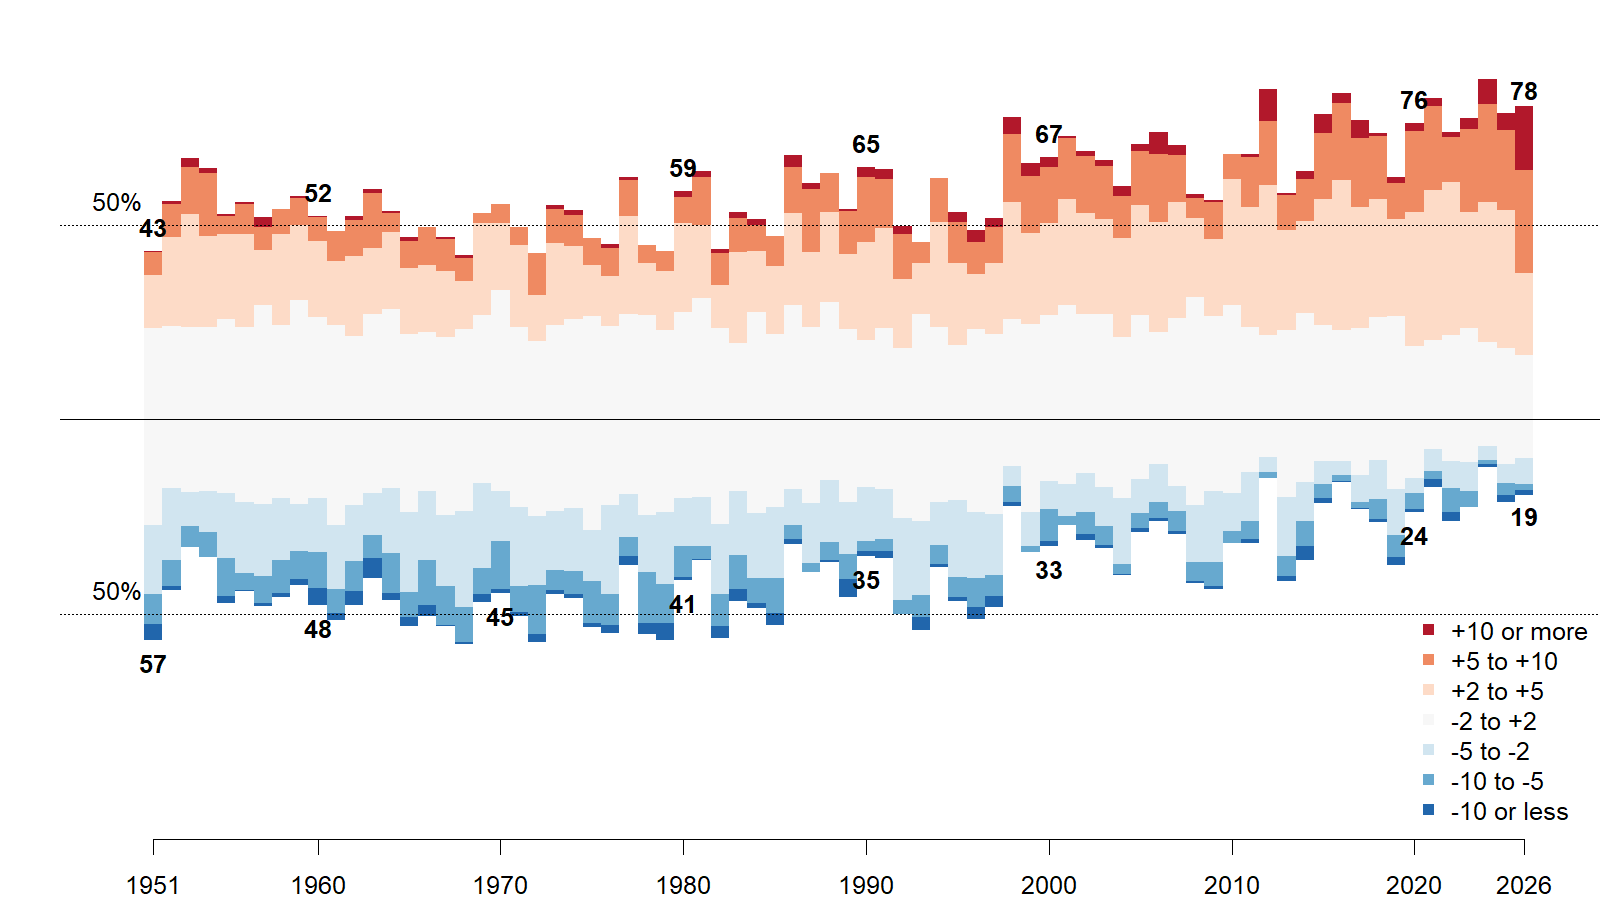
In absolute terms, Colorado's temperatures are lower than the national average, and if anything, the national picture shows a larger share of days in recent years warmer than baseline compared with Colorado. However, the temperature swings in Colorado have been more extreme. In Colorado we see substantially more days that are 5 degrees or more warmer compared to the the baseline than is true nationally in nearly every year. The same is true for temperature swings in the colder direction.
Some concluding thoughts
There are some contributing factors (El Niño is a particularly important one this year) that have made 2026 an unusually hot and dry year for Colorado, but it is undeniably part of a bigger trend, and there is evidence that global factors like El Niño are themselves affected by a changing climate. Temperatures are warmer on average and the swings are more extreme due to climate change. Compared to the rest of the country, Colorado is experiencing wider swings from colder weather to warmer weather, and this variability can be a significant problem itself.
While Colorado can have only limited impact on the monumental global task that is reducing greenhouse gas emissions, the more pressing problem is how we respond to this slow-burning catastrophe. The political choices we make now will help determine the ways that our changing climate impacts people. As I said last time, there are no natural disasters. The disastrous impacts of natural phenomena (even those that have been spurred along by human activity) are always the results of human agency at some point.