Housing affordability in Colorado


Colorado has one of the least affordable housing markets in the country. A recent report from the National Low Income Housing Coalition ranked Colorado among the least affordable housing markets in the country. This was an issue that came up over and over in my recent review of state legislative candidates' webpages and is surely going to figure prominently in the midterm elections later this year.
The Bureau of Economic Analysis (BEA) publishes data on relative prices across the country that can be used to compare the costs of housing and other expenses. The BEA data show that Colorado housing has been consistently more expensive than the national average and the gap has been growing in recent years. The figure below shows the trend since 2008.
Relative costs in Colorado compared to other states, 2008-2024
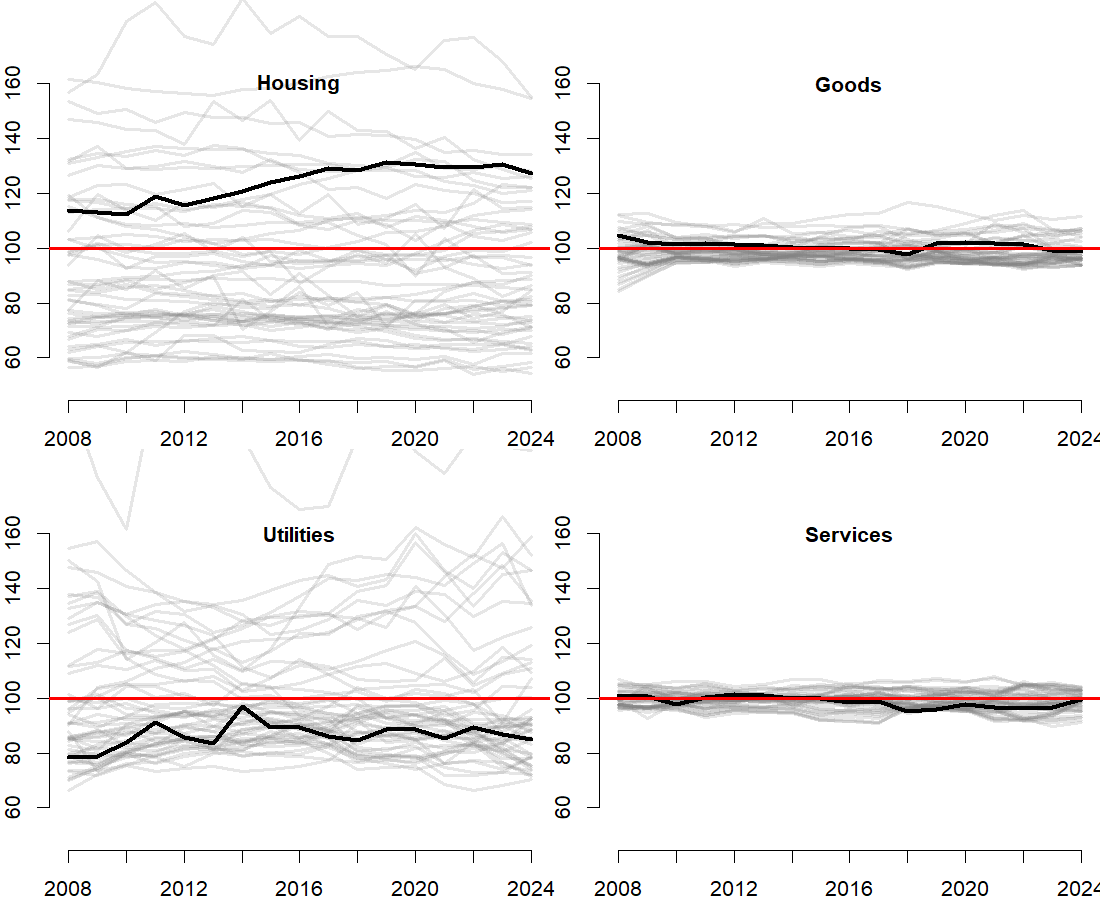
It is important to note that the figure above shows only the relative cost of each category of expenses compared to the national average in each year (e.g. it does not account for inflation). Costs have risen across the board in many cases, but Colorado still stands out relative to other states when it comes to housing.
During this period, housing in Colorado has been significantly more expensive than the national average. In 2024, Colorado had the fifth-highest housing price level in the country (DC and California claim the dubious number one and two spots). The other panels in the plot show that housing is the driving factor making life more expensive in Colorado. Goods and services are very close to the national average, and utilities are substantially more affordable in Colorado compared to other places.
About the data in this post
In addition to the BEA data above, this post will rely on data from the decennial Census and American Community Surveys (an annual survey program conducted by the Census Bureau since 2001). This survey includes data for thousands of Colorado households each year and can be used to explore differences across subsets of the population. The data was downloaded from the IPUMS USA tool (a fantastic resource for harmonizing government data). The data goes back to 1970, but in this post, I will focus most on the period after 2000.
Housing trends in Colorado
Apart from some very minor movement in the 2010s (when somewhat fewer Coloradans were in owner-occupied homes and somewhat more were in rental units), the overall mix of housing for Coloradans has remained very stable over the past several decades.
- Slightly more than 60% of Coloradans live in single family homes that they have either purchased outright or on which they are paying a mortgage.
- Just under 10% of Coloradans live in other kinds of homes (condos, mobile homes, apartments) that they own outright or on which they are paying a mortgage.
- About 20% of Coloradans live in single family homes that they are renting.
- The remaining 10% or so live in other kinds of units (apartments, condos, etc.) that they are renting.
Despite the rapid growth of the state over this period (in 1970, Colorado was home to 2.2 million people; today more than 6 million live here), the overall mix of housing has been remarkably constant.
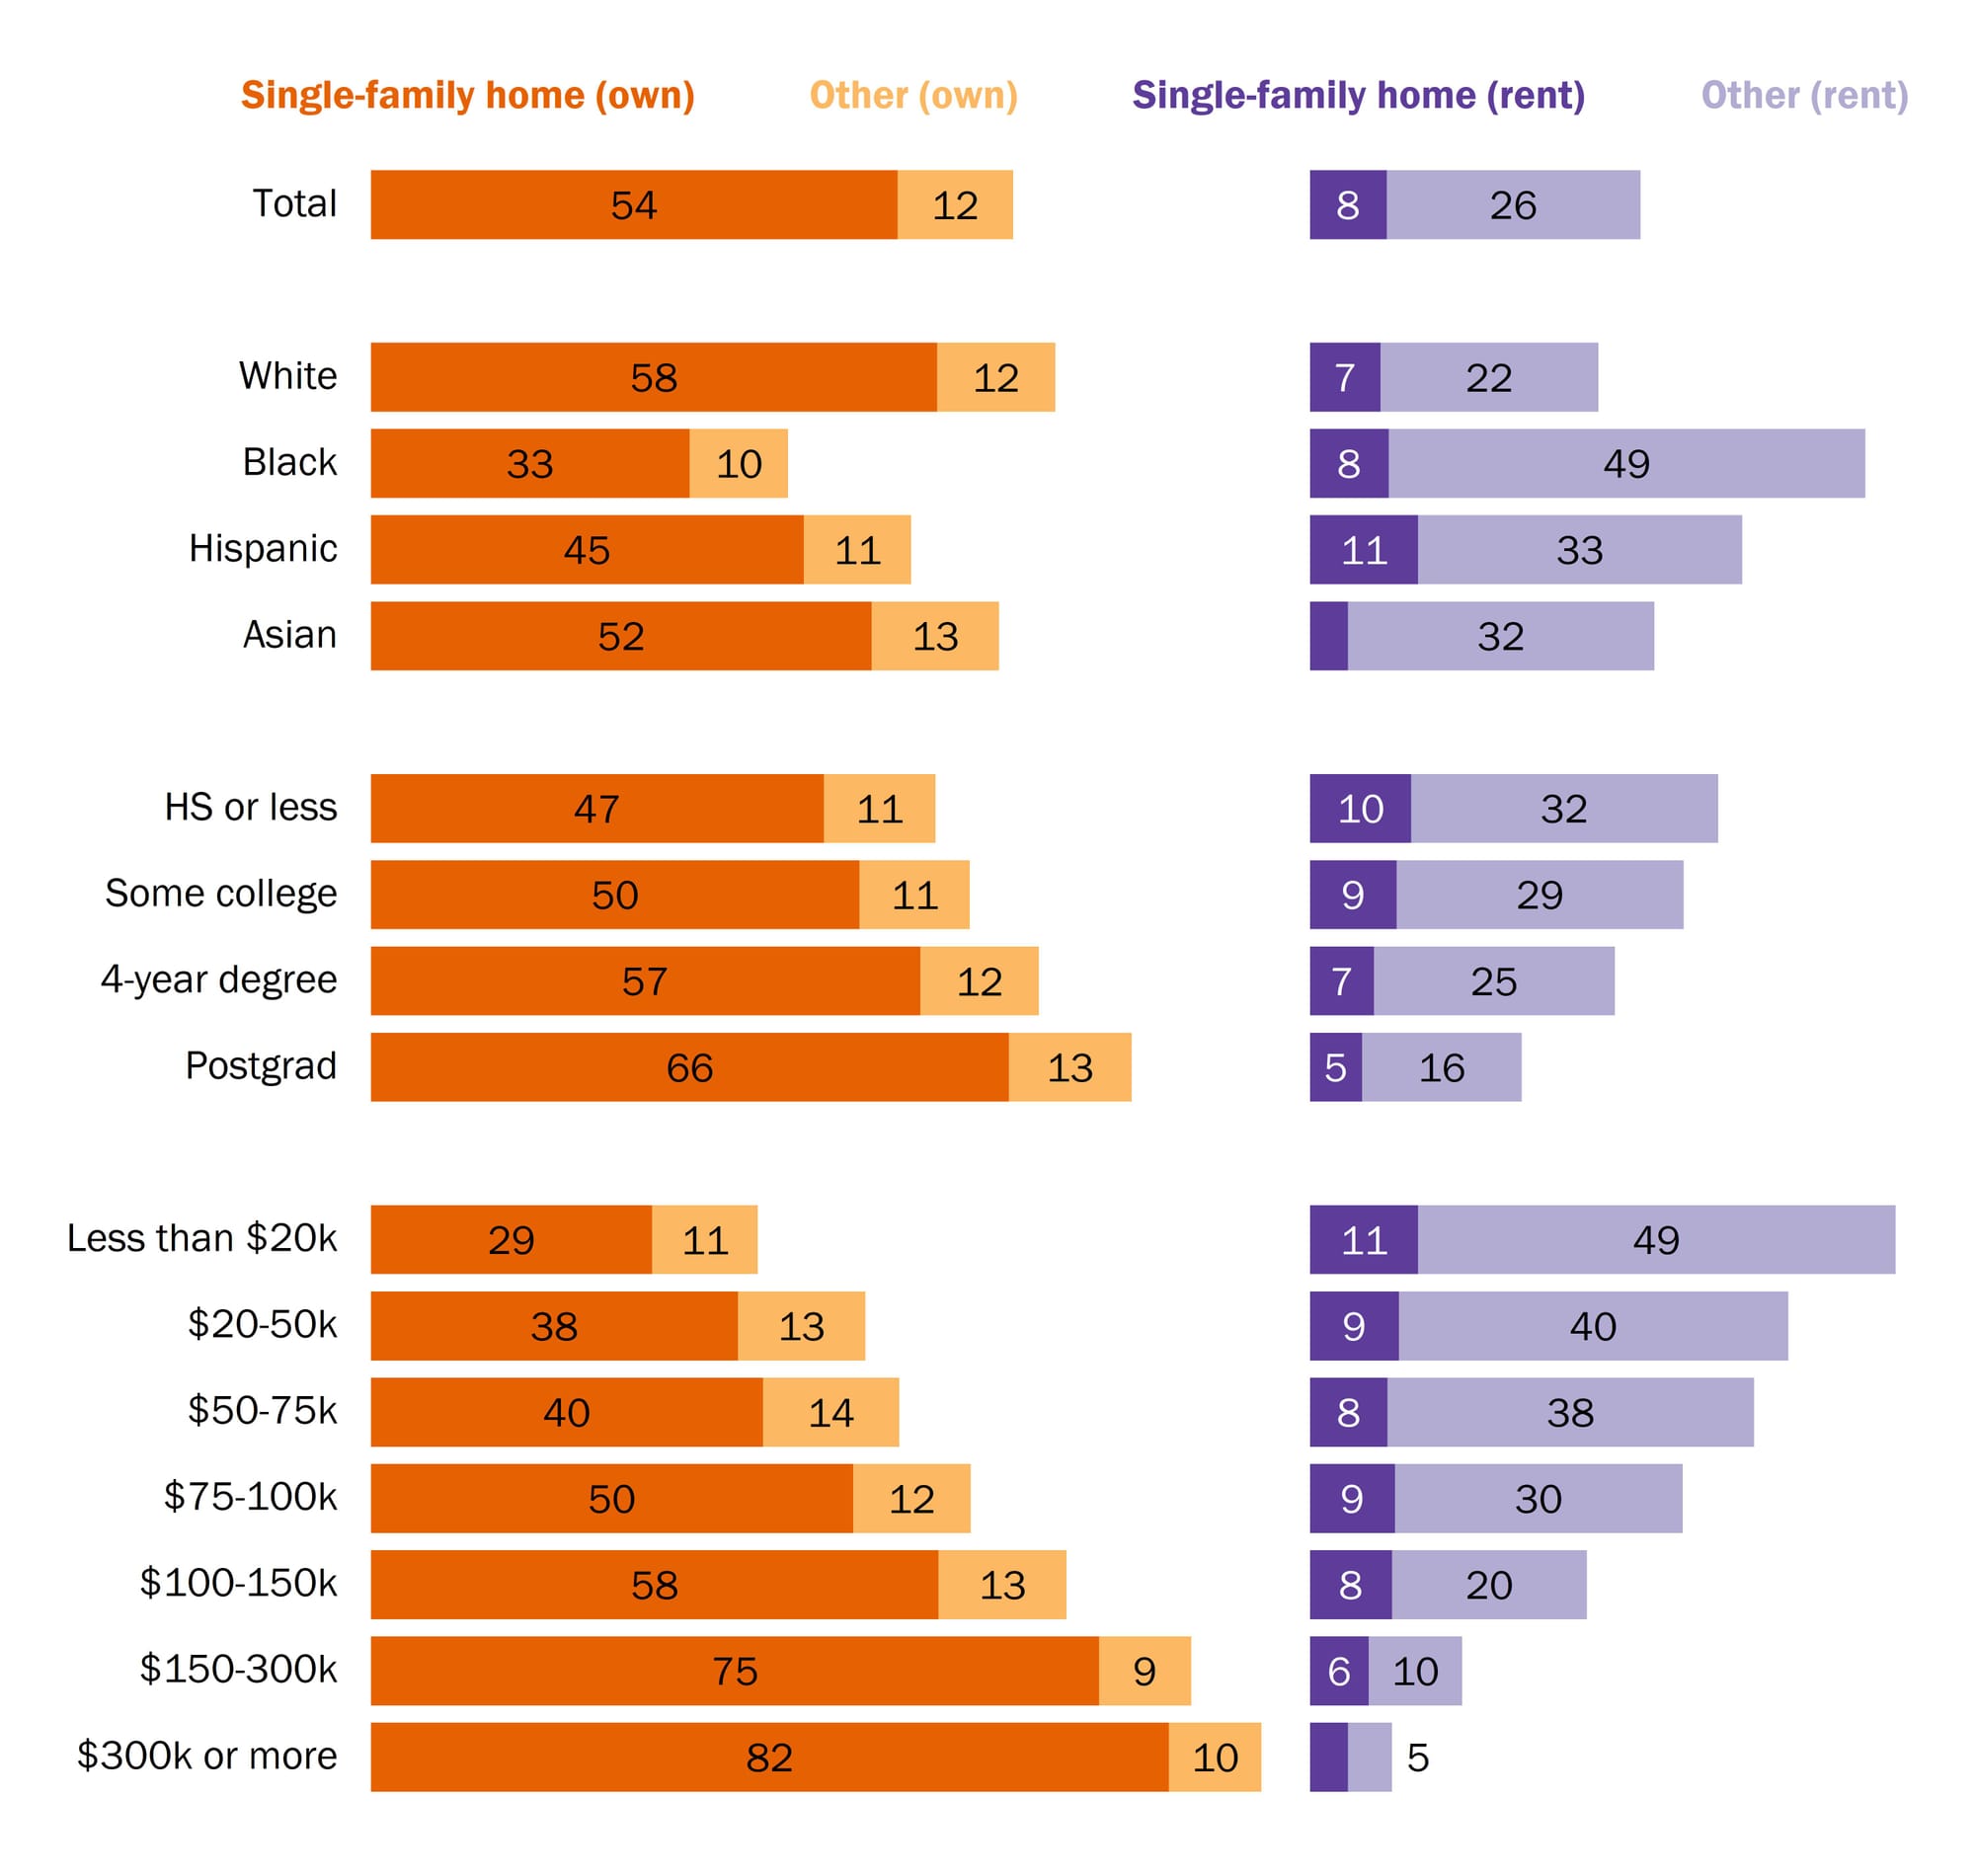
The graphic below shows the demographics of heads of household for those who own or rent their residence in the most recent year for which we have data (2024). The data show large demographic divides by race (White Coloradans are substantially more likely to be living in single family homes they own compared to those of other races and ethnicities), education (rates of ownership increase steadily with education) and household income (ownership rates are strongly associated with household income).
Ownership and rental rates by householder characteristics for those living in Colorado, 2024
Housing cost burden
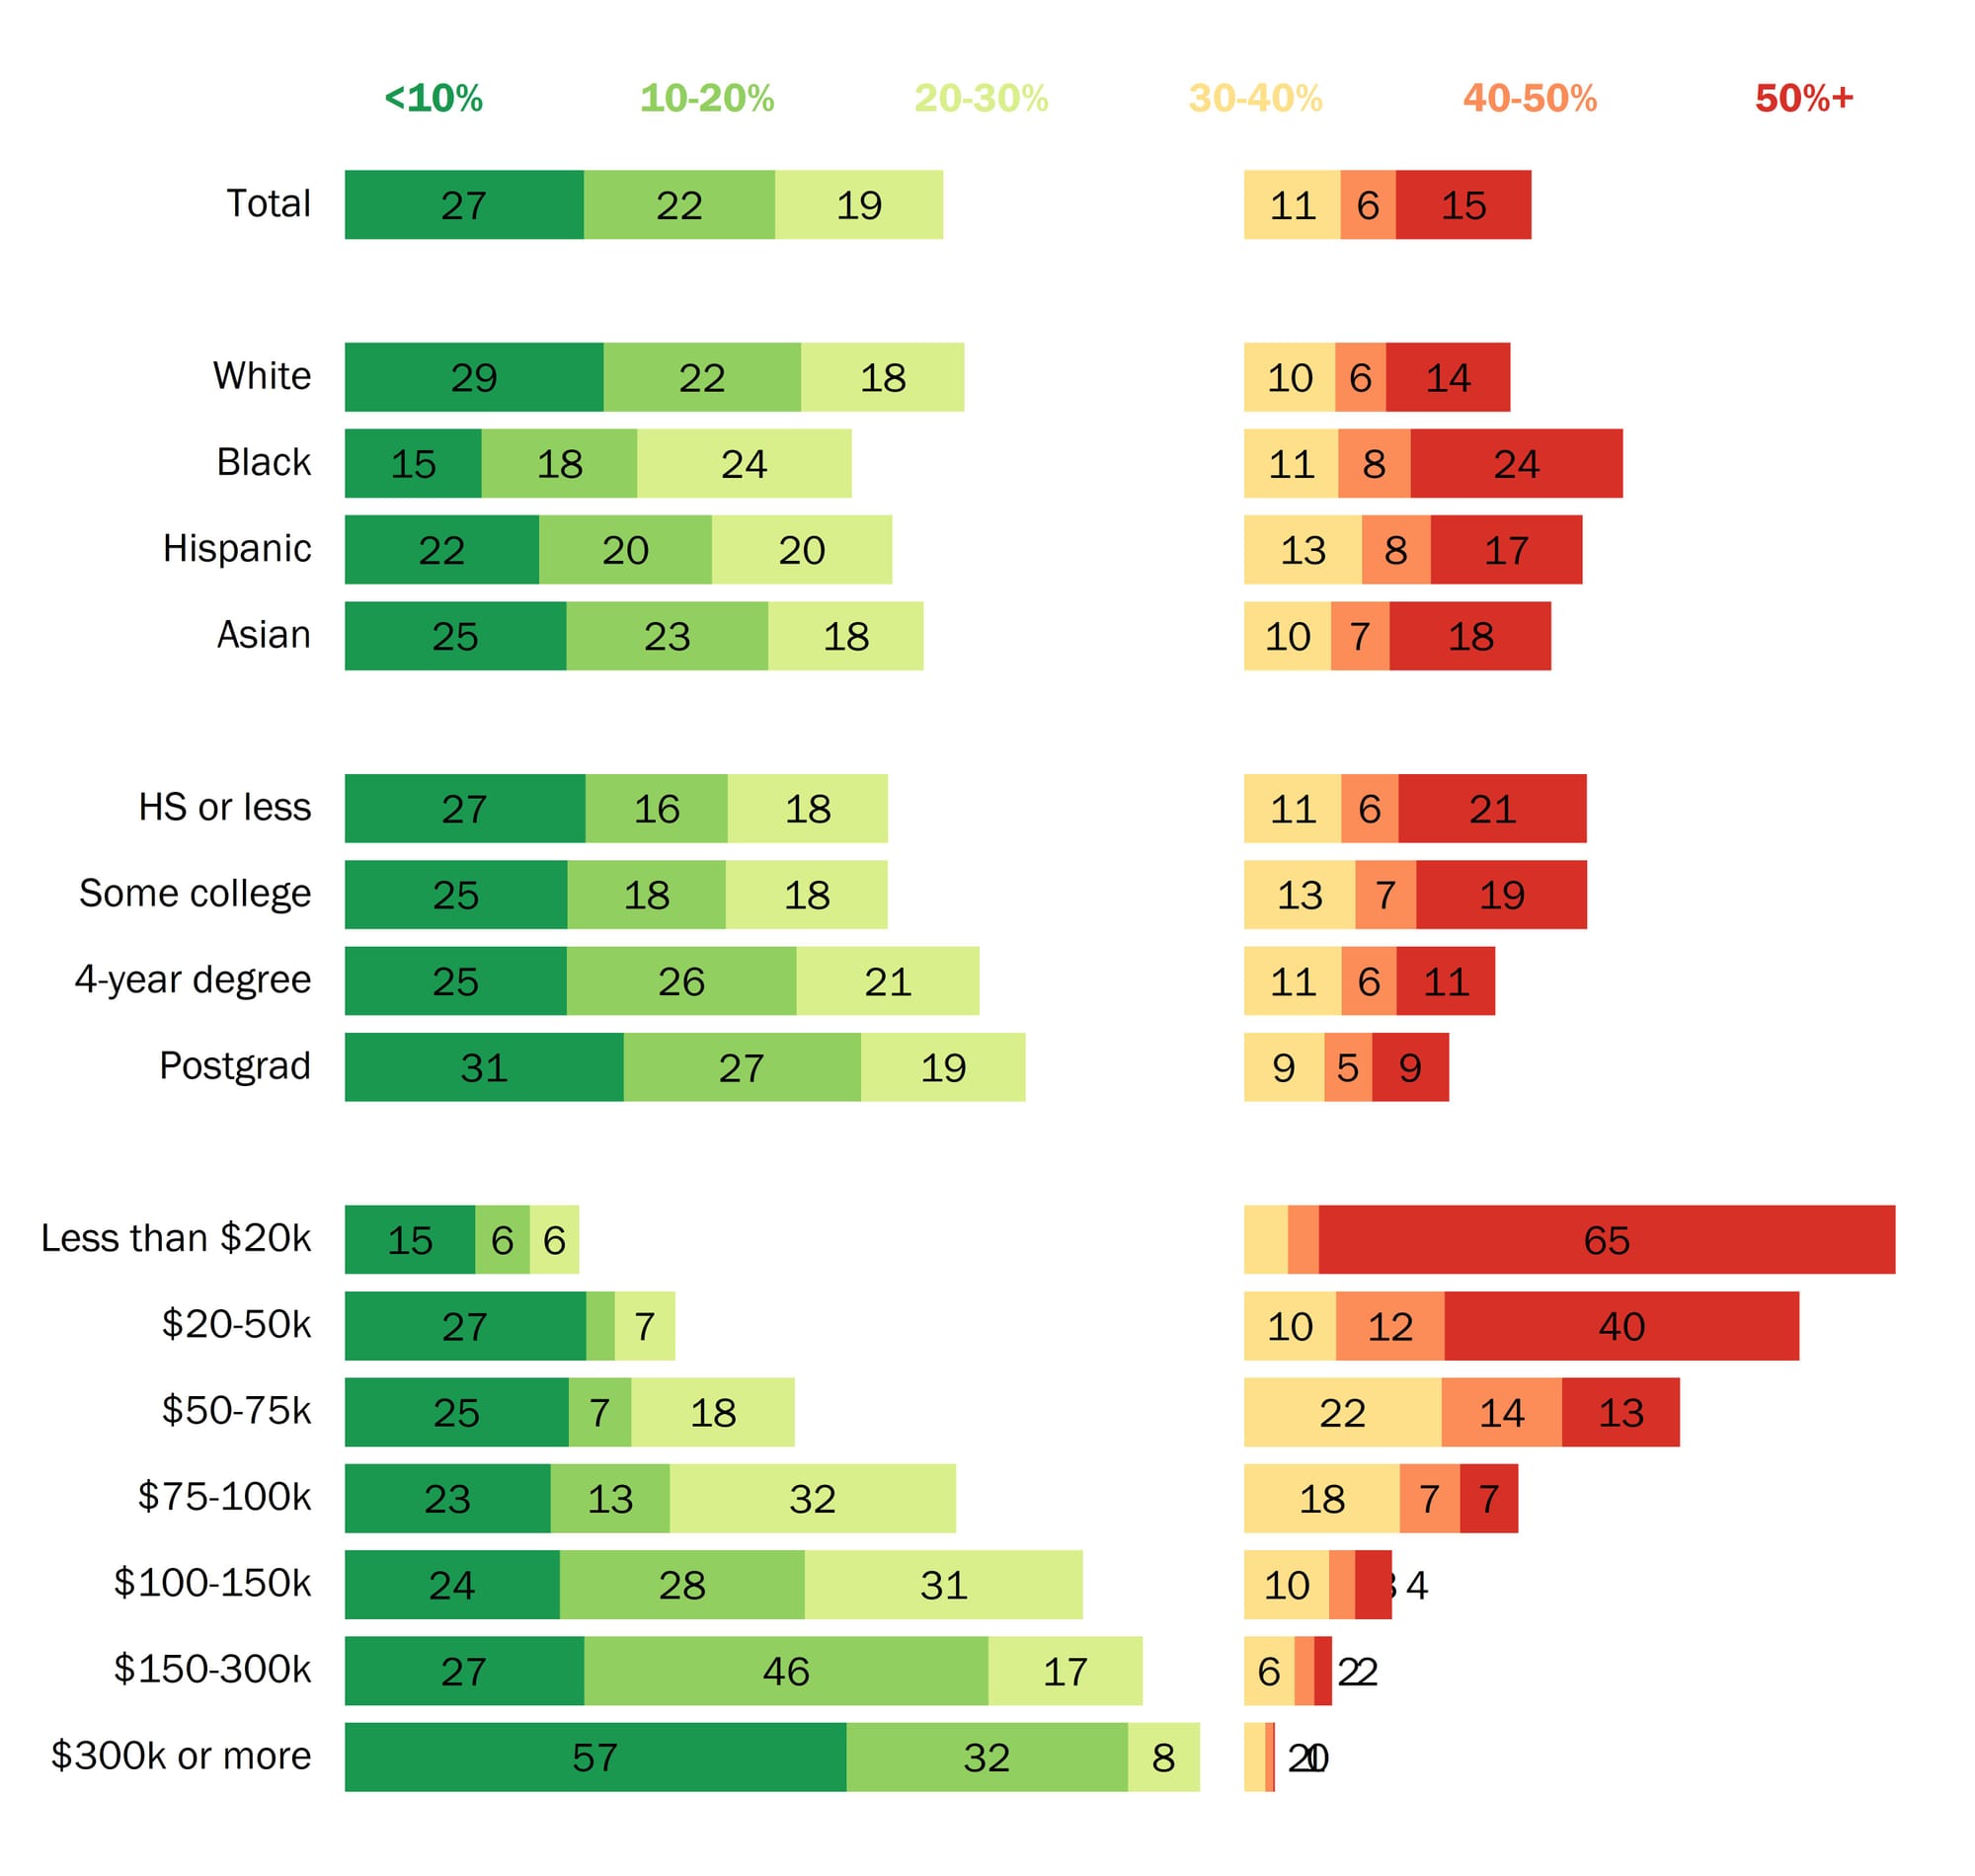
Housing researchers commonly define a household as cost burdened if it spends more than 30% of its gross income on housing. The 30% threshold has long been used by the U.S. Department of Housing and Urban Development (HUD) and the Census Bureau as a benchmark for housing affordability.
The graphic below shows the distribution of housing cost burdens by different householder characteristics. The green bars on the left-hand side of the graphic show those who fall under the 30% threshold (about two-thirds of Colorado households). About a third of Colorado households pay more than 30% of their income in housing costs (15% pay more than half of their household income). It is no big surprise that total household income is so strongly associated with housing cost burdens, but it is an indicator of the lack of affordable housing in the state.
Share of households that are paying __ of their total household income in housing costs, Colorado, 2024
The graphic below further breaks out this measure of housing burden by whether a household owns or rents their property. Just over one in five Colorado households who own the property they live in are paying 30% or more in their family income on housing costs. Among renters, this figure rises to over half (53%).
Households paying 30% or more of their household income on housing costs by ownership in Colorado, 2024
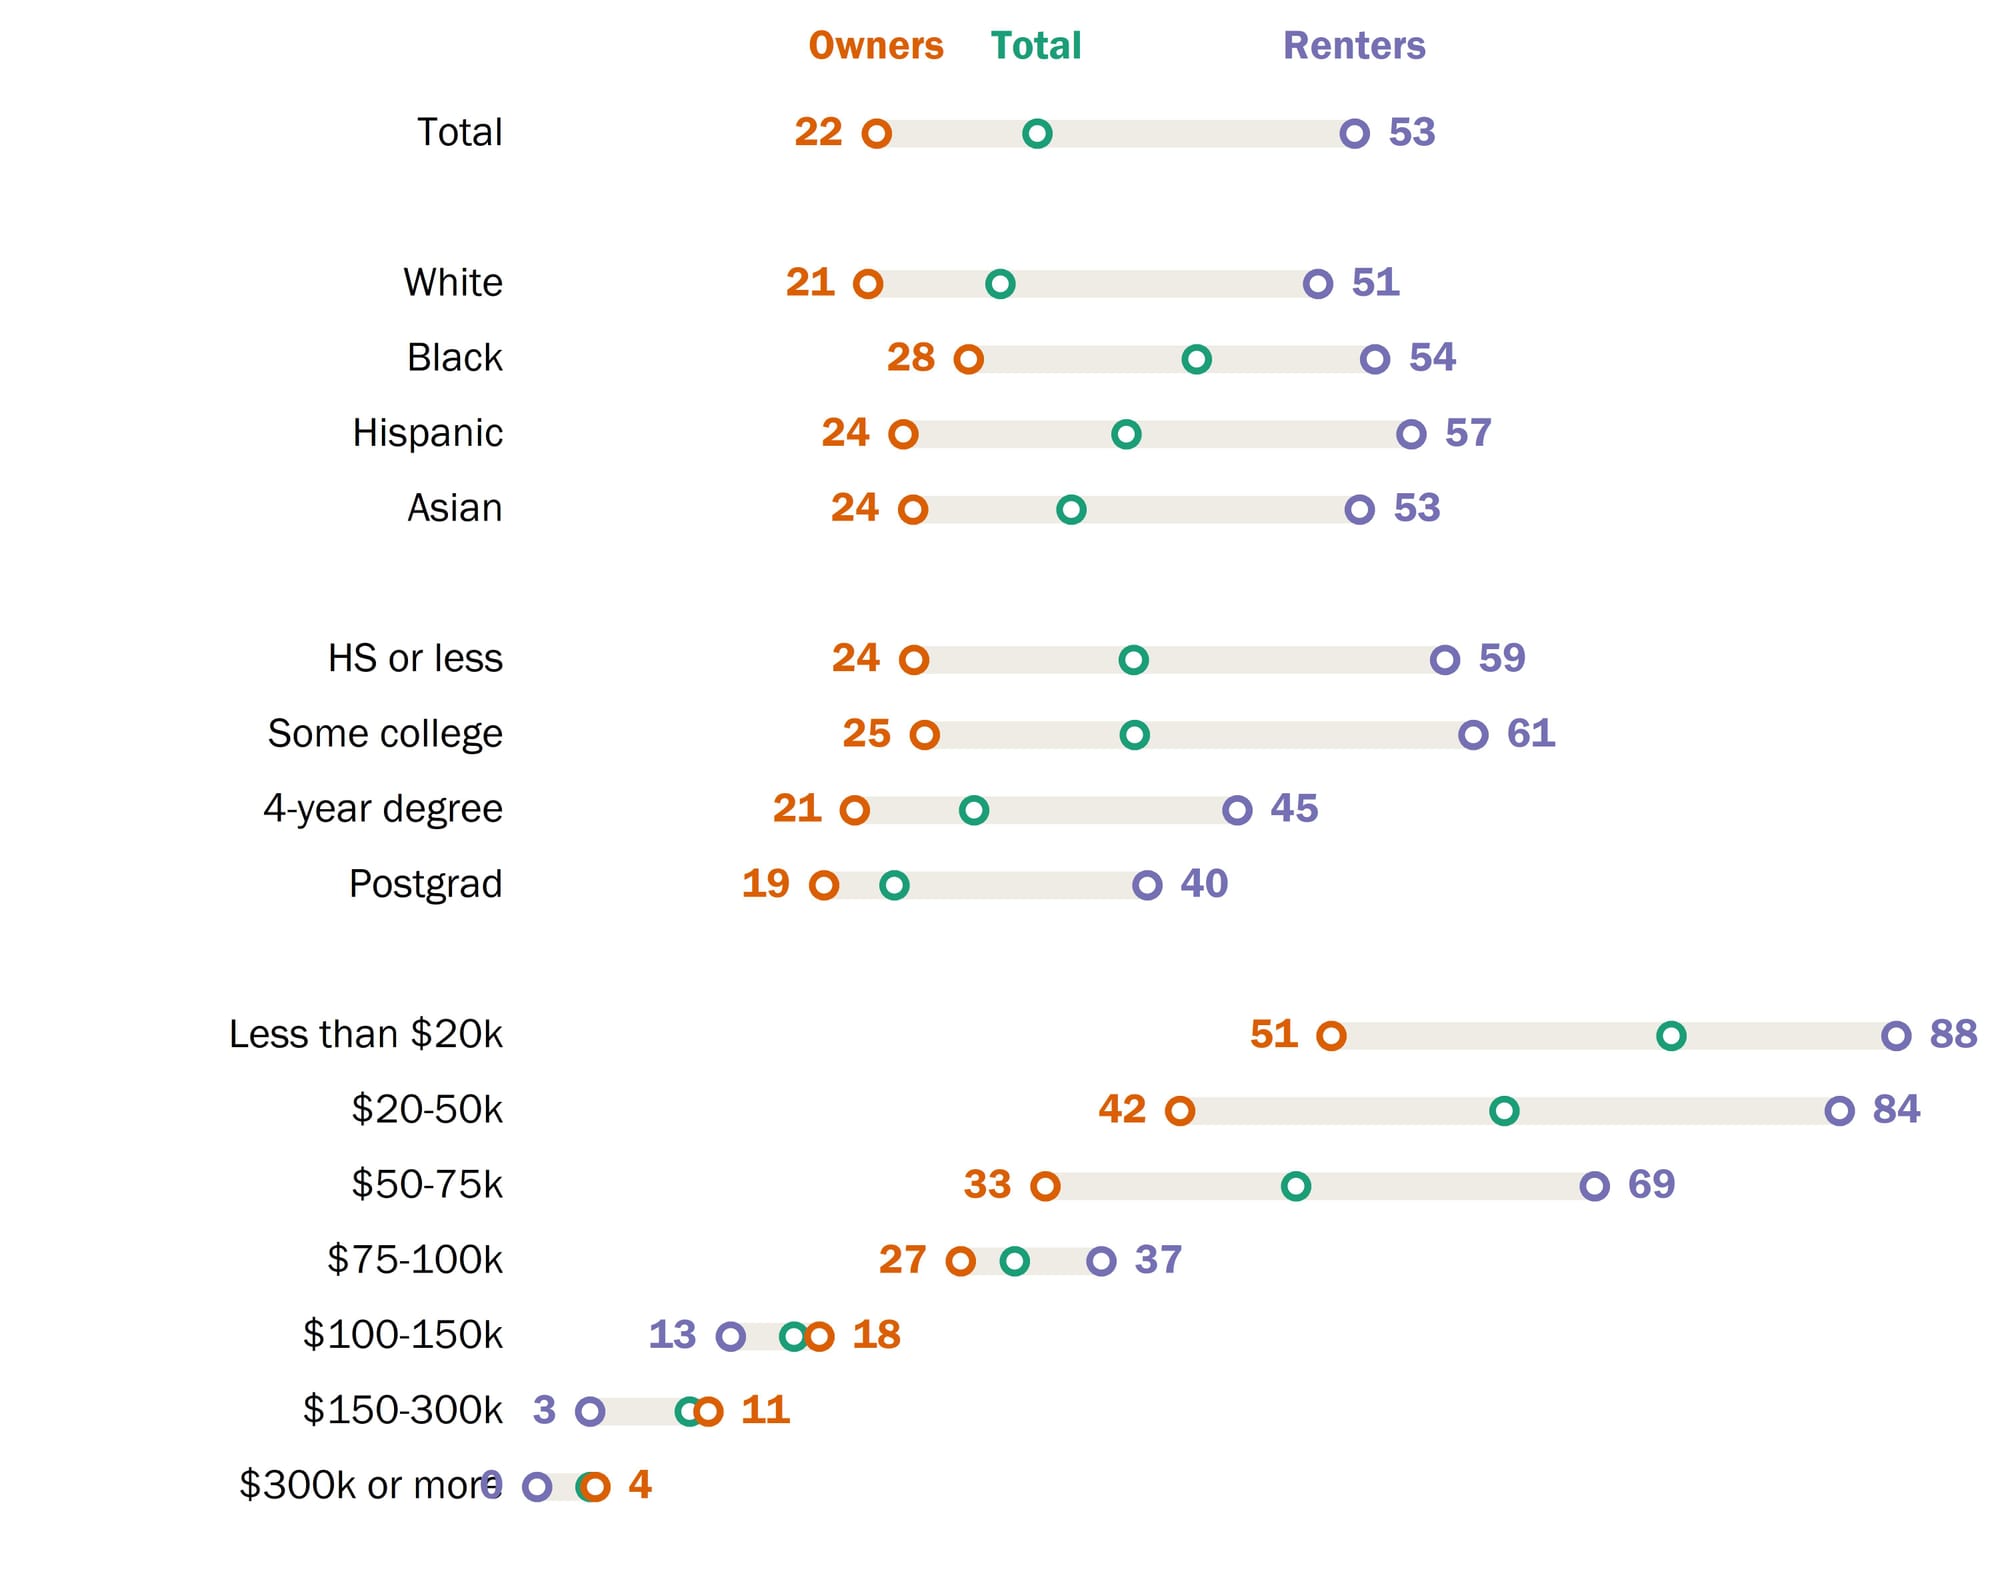
Once again, household income is the most strongly associated household characteristic with housing burden. Among Colorado renter households making less than $50,000 per year in 2024, more than 80% were paying at least 30% of their household income in rent. Of course, these are also the households that have the least financial cushion when other costs rise or unexpected expenses come their way.
Among almost all groupings of Colorado households, owners were less likely to be spending at least 30% of their household income on housing costs. The only exception was among households making more than $100,000 per year (although it should be noted that rates of housing burden among these households were the lowest for both renters and owners compared to other groupings of households).
Concluding thoughts
Housing is typically the largest single expense category for American households, and in Colorado housing contributes more to Colorado's above-average costs than any other category. This burden falls especially hard on populations that are already financially stressed. The politics of housing is especially complicated in the United States where it is also often the single largest asset and store of wealth for American households. Homeowners often oppose policies that would expand the supply of housing out of fear that they would negatively affect the value of their homes or change the "character" of their communities.
Time will tell whether the Housing Opportunities Made Easier (HOME) Act passed in the most recent legislative session will have its intended impact of making it easier to expand the supply of housing or be broad enough in scope to substantially impact the market, but the problem of housing affordability in Colorado will be an important issue for the foreseeable future.