Colorado's green energy revolution


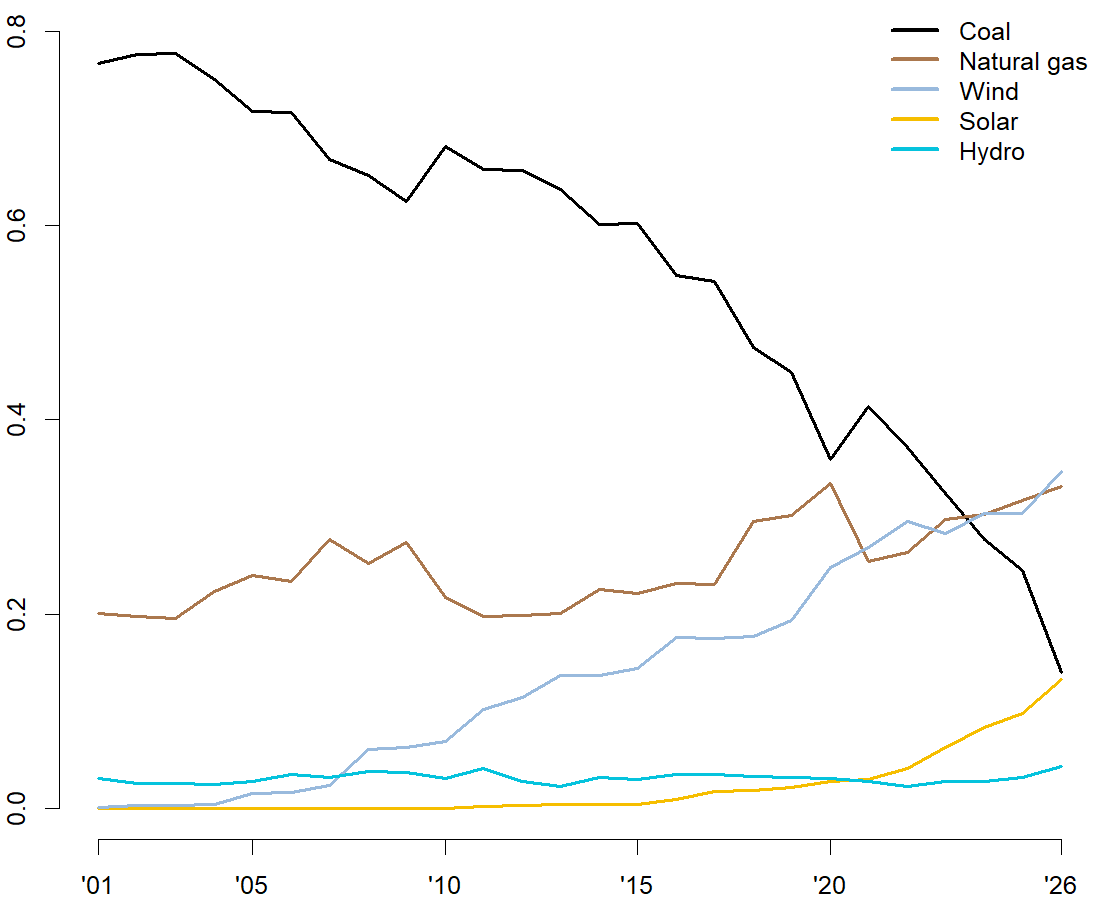
Energy production in Colorado has shifted dramatically over the past 25 years. At the turn of the century, more than three-quarters of the electricity produced in Colorado was generated in coal-fired power plants. A few years ago, wind power overtook coal in total megawatt hours produced, and this year, for the first time, Colorado is producing about as much power from solar as it is from coal. According to the latest data from the Energy Information Administration, this year is the first year in which the share of energy produced from green sources (wind, solar and hydroelectric) is greater than that from fossil fuels.
The graphic below shows the mix of major power sources in Colorado since 2001.
Share of Colorado's energy production from each source, 2001-2026
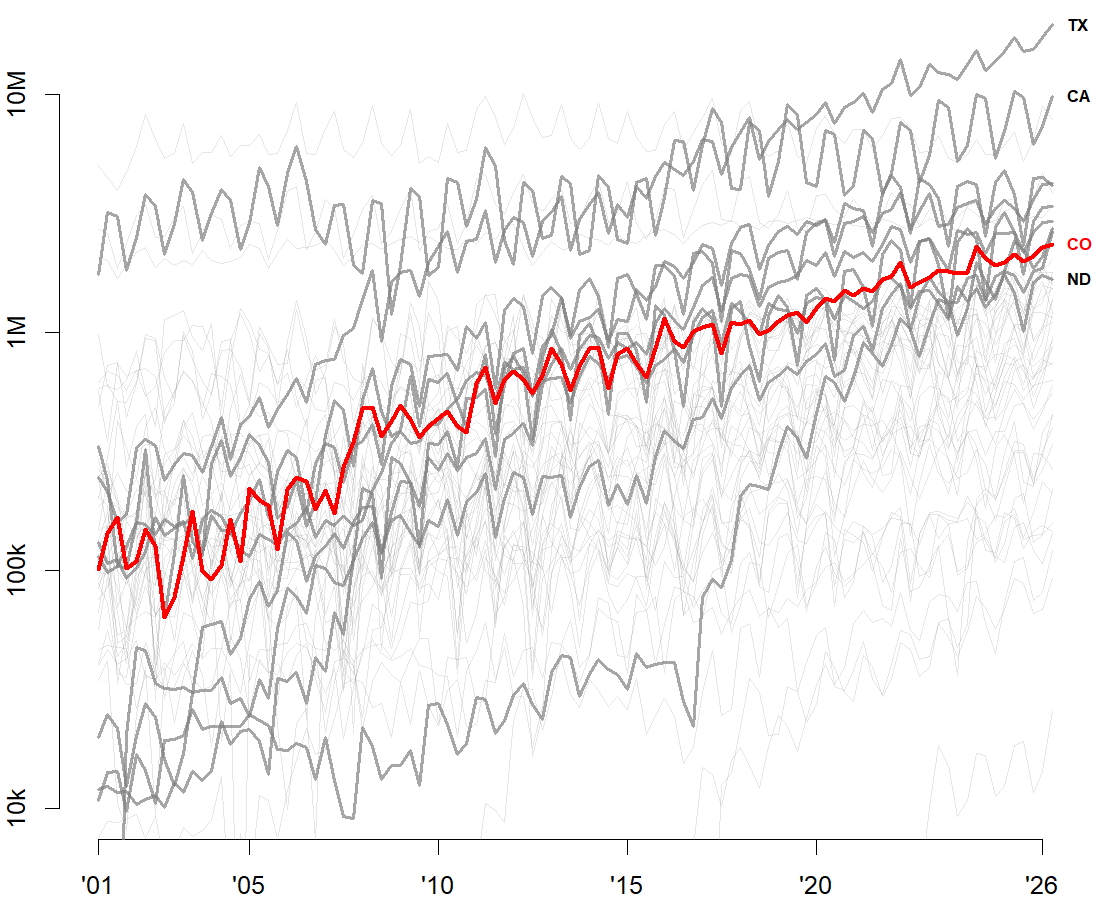
This transformation of Colorado's electricity production mix has happened remarkably quickly. Colorado has increased adoption of green energy sources at a pace faster than most U.S. states (by my accounting, it is seventh overall during this period). Overall, Colorado is 12th among states in total green power production during 2026 to date.
In the first two quarters of 2001, Colorado averaged about 120 thousand megawatt hours of green energy per month. In the first two quarters of this year, that figure had increased nearly 20 fold to an average of 2.3 million megawatt hours per month.
Green energy production by state, 2001-2026