The impact of mail-in voting in Colorado


Voting is the most fundamental form of political activity in the United States, and Colorado has consistently ranked among the highest turnout states in the country. Colorado also has a more accessible system than the average state. Since the move to all-mail voting in 2013, Colorado regularly ranks among the ten states that impose the lowest costs for voting in the nation.
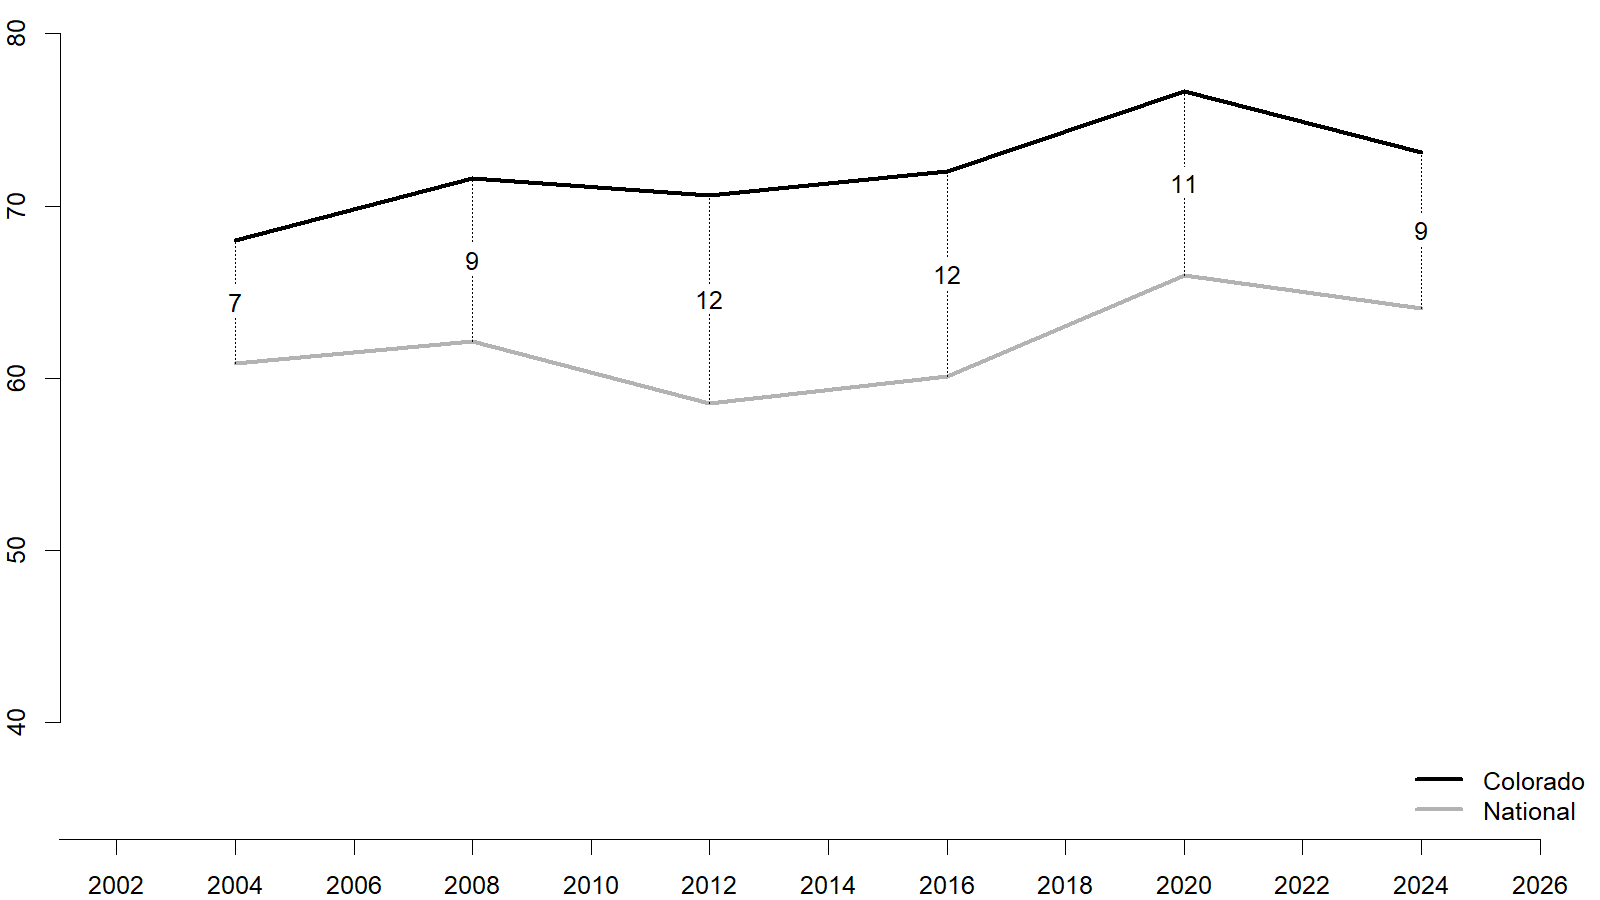
The graphic below compares the turnout in Colorado to the nationwide average. In the last several elections, turnout in Colorado has been about ten points higher than the national average.
Turnout rates in presidential elections, 2004-2024
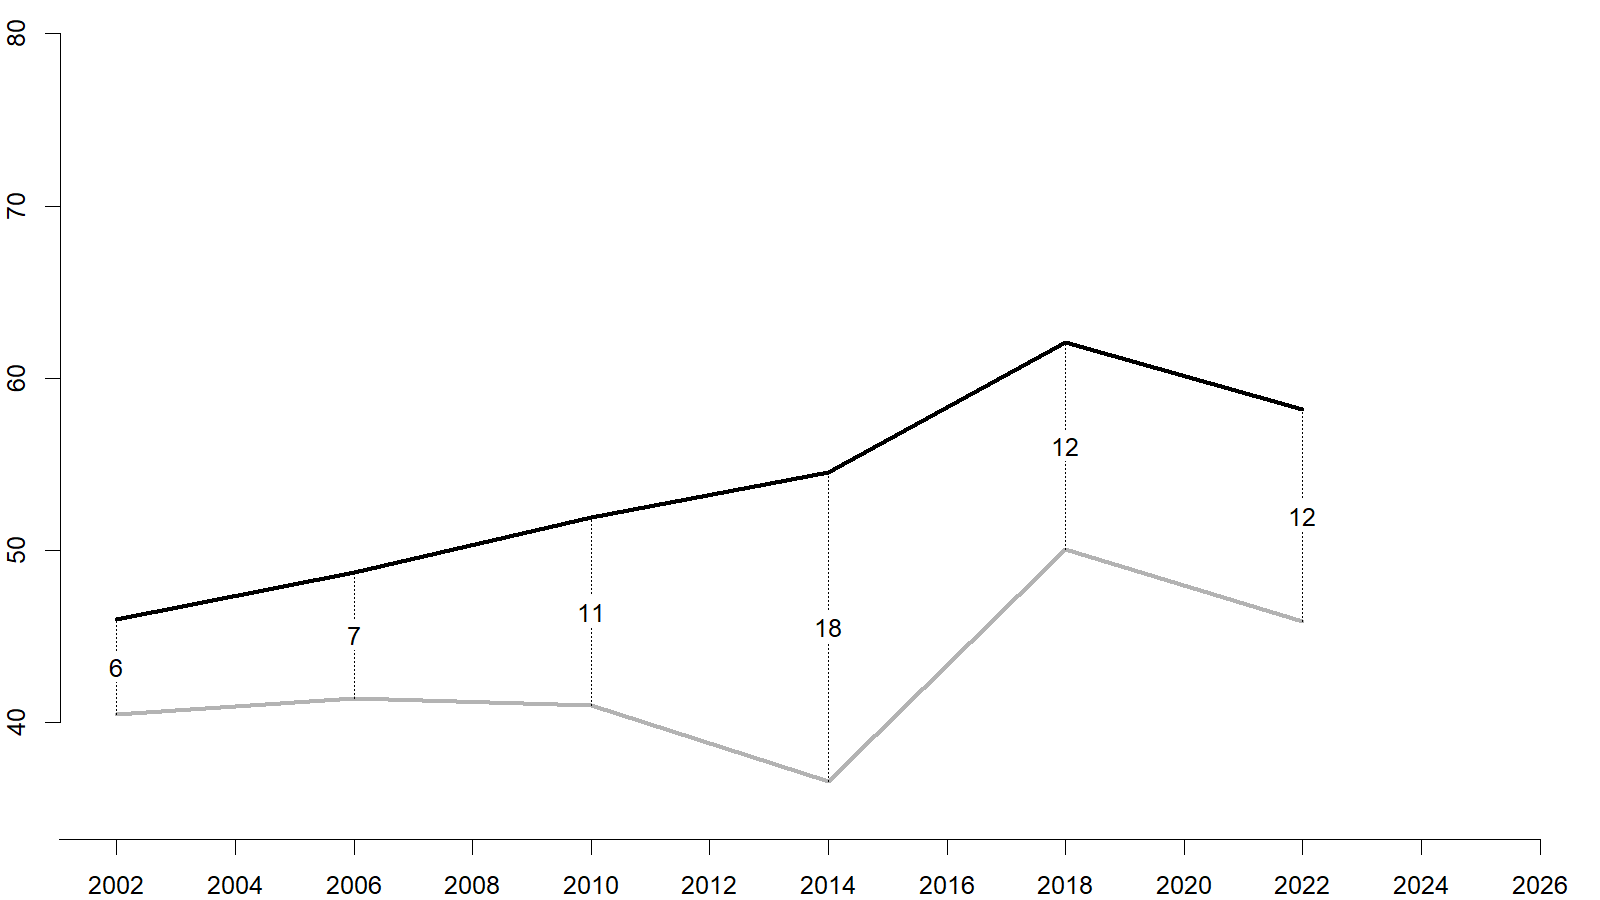
We can see the same pattern when it comes to turnout in midterm elections. Turnout is lower overall in these generally less intense campaigns, but in every election since at least 2002, turnout in Colorado has been substantially higher than the national average.
Turnout rates in midterm elections, 2002-2022
Turnout in Colorado was higher than the national average even before the implementation of all mail elections in the state. This highlights a fundamental problem in policy evaluation faced by social scientists. Did the change in policy have some independent impact on participation in elections in the state? Or are places that have a preexisting culture of high participation just more likely to enact laws formalizing it? Social scientists call this endogeneity, and it haunts almost everything we do. The bulk of this post will be devoted to trying to answer that question.
Estimating the impact of vote by mail in Colorado on turnout
Naïve comparison
One way to try to understand the impact of the vote by mail policy in Colorado is to look at the difference between Colorado and the rest of the country. In 2014 (the first major election cycle when this policy was implemented), this difference was about 18 percentage points. Of course, this approach ignores the fact that turnout was higher in Colorado even before the policy was implemented.
Difference-in-differences
Another (better, though still imperfect) method to try to identify the impact of a policy is called difference-in-differences estimation. This approach proceeds just like it sounds. Rather than looking at the raw difference between turnout in Colorado and turnout in places that did not implement mail voting, we look at the difference in the differences pre- and post-policy. It is easiest to see this in the midterm graphic above. In the 2010 elections, national turnout was 41% of the voting-eligible population, and it declined substantially in the 2014 midterms to just under 37%. In Colorado, turnout increased from 52% in 2010 to nearly 55% in 2014. So, we have a -4.4 percentage point change nationally and a +2.6 percentage point change in Colorado. The very rudimentary difference-in-difference estimate for the impact of vote by mail would be a +7 percentage point increase in turnout.
Of course, things usually aren't so simple.
Multiple regression
One way to formalize the logic of the difference-in-differences estimation while also accounting for other differences between Colorado and other localities is with multiple regression. Multiple regression is a method to isolate the impact of multiple factors simultaneously on an outcome of interest (in our case voting in elections). In this context, it allows us to account for demographic differences between Colorado and other states as well as election-year specific effects. The regression estimate after controlling for other factors indicates that turnout in midterm elections in Colorado is about 9 percentage points higher than we would expect with all-mail voting implemented (the estimate for presidential years is about half as strong: 4 percentage points).
This method can also be used to estimate the impact of the policy among different demographic groups. The figure below shows the regression estimates among different age groups. Age is one of the strongest predictors of turnout. Turnout increases steadily with age until about age 70 when it begins to tick down (as health problems make it difficult for some to vote). In the midterms between 2002 and 2022, turnout among Americans under 30 averaged 27%. Turnout among voters in their 60s in these same elections was about twice as high (63%).
The impact of mail-in balloting seems to be strongest among those in their 30s and 40s. The figure below shows the estimated impact of vote-by-mail in Colorado by age category. The effects are generally stronger in midterm election years where turnout overall is lower.
Estimated effect of Colorado's vote by mail policy by age group
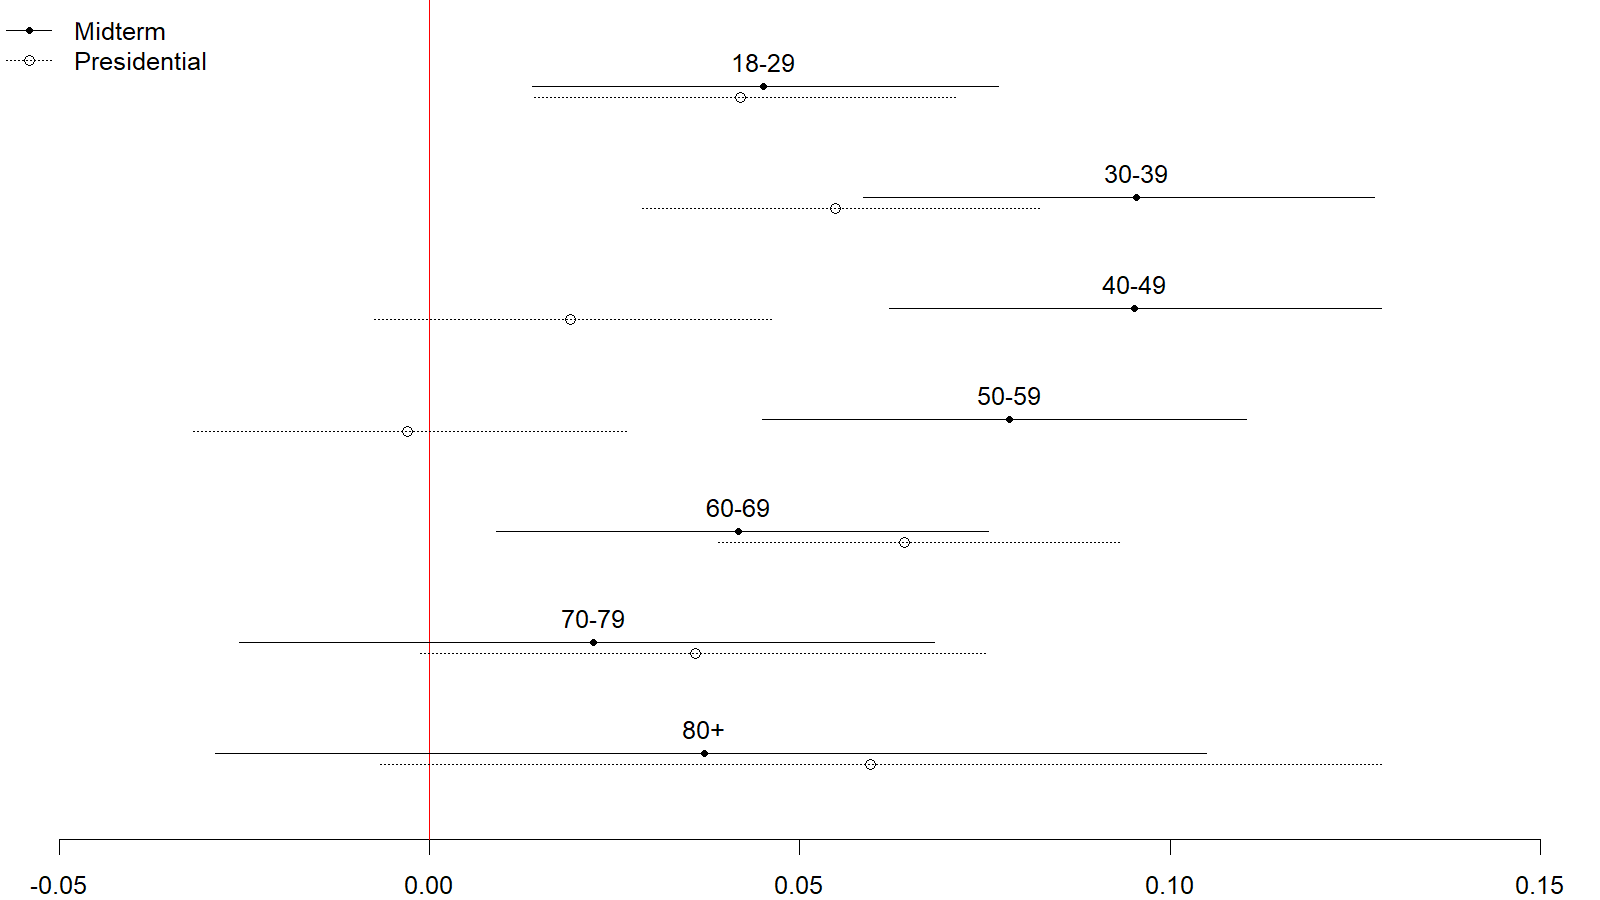
It is worth pausing a moment to discuss the differences between the presidential and midterm estimates in this figure (and the one that will follow). One interpretation of the large difference between the estimates for people in their 40s and 50s–who see an effect of about 10 percentage points in midterms but perhaps not at all in presidential elections–is that there is some part of these populations that are motivated to get their ballot counted in presidential years but who previously found it too costly to vote in midterm elections. Contrast this with the under 30 group that shows the same impact of vote by mail on both presidential and midterm elections.
We can perform the same kind of analysis looking at educational attainment rather than age groupings. The graphic below shows the results of that analysis.
Estimated effect of Colorado's vote by mail policy by educational attainment
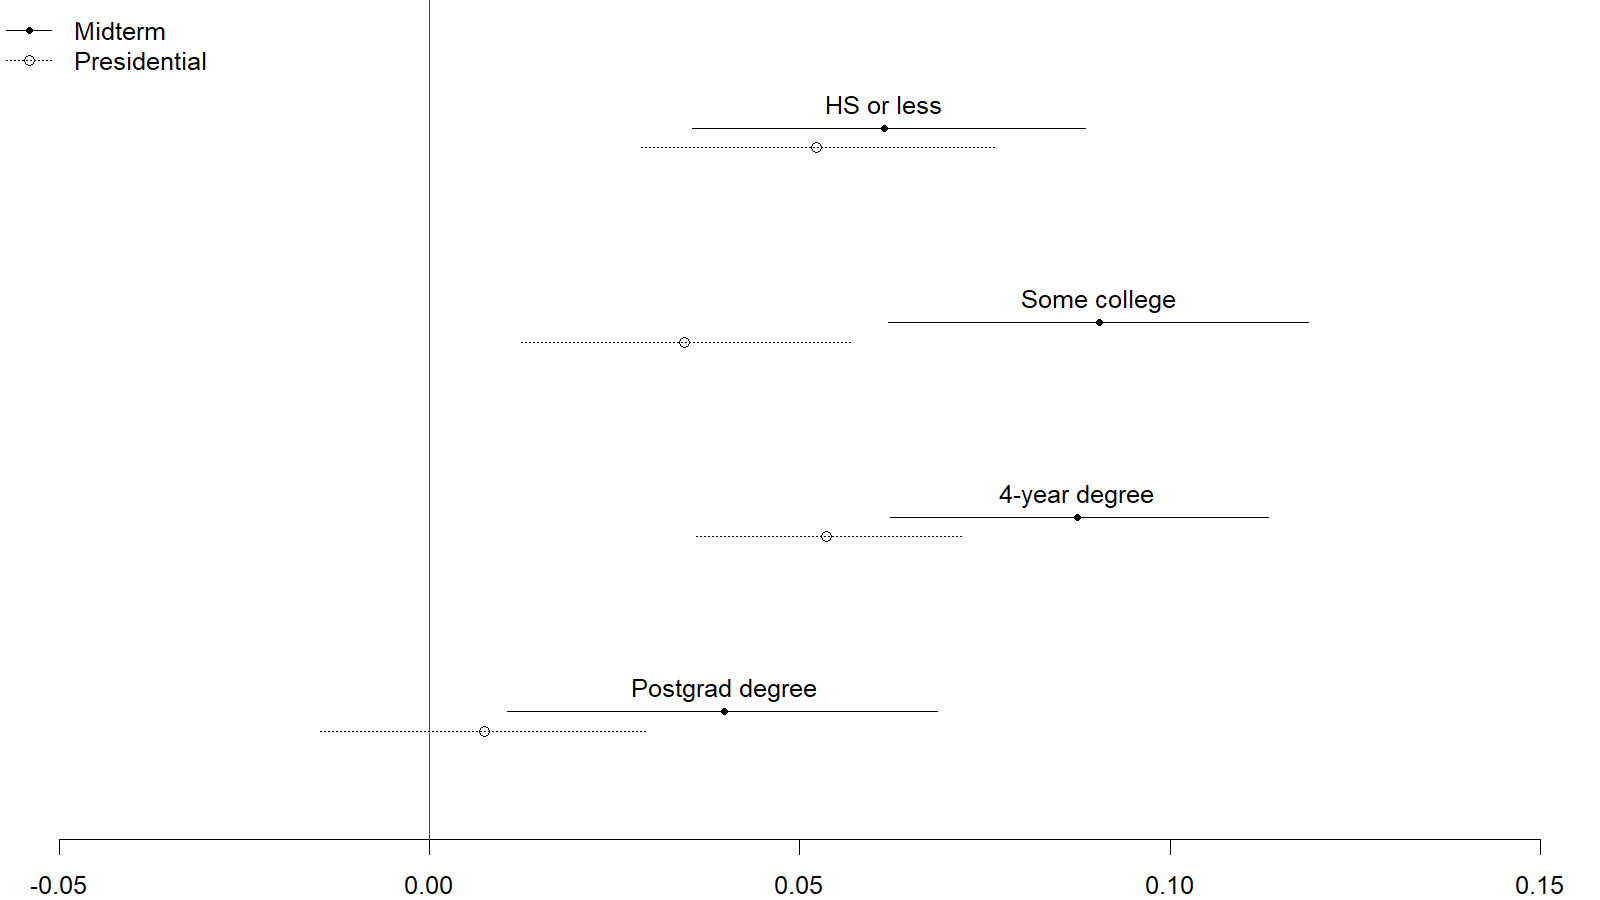
Since 2002, less than 40% of Coloradans with a high school degree or less vote in a typical midterm election compared to over three-quarters of those with a postgraduate degree. Similar to the age analysis, the part of the electorate with the lowest propensity to vote shows consistent effects across both midterm and presidential elections while those with the higher rates of turnout show significantly smaller effects in presidential elections.
Concluding thoughts
Colorado's vote by mail policy contributes to about a 9 percentage point turnout bump in midterm years and about 4 percentage points in presidential years. As is the case in other states around the country, Colorado fits the pattern of places that have higher-than-average turnout already implementing policies that are designed to further boost participation (while some of the states with the lowest rates of political participation seem intent on making it more difficult to vote).
In recent years Republican lawmakers have taken particular aim at voting by mail. Led by President Trump's repeated and unfounded attacks on voting by mail (despite his personal history of voting by mail), these moves are particularly ironic given the shift in the political landscape. Trump's victories in 2016 and 2024 were driven in large part by lower-propensity voters (precisely the voters that see the biggest increases in turnout from these measures).