The diploma divide: Nationally and within Colorado
This post walks through one of the most significant changes in American politics over the past 50 years: the reorientation of politics across educational lines. I trace how this trend has evolved nationally and within Colorado.

Colorado has been undergoing a great deal of demographic change over the past 50 years. In 1976, the state was much less diverse, less educated and younger than it is today. For the most part, Colorado has mirrored national trends as the country has become more diverse, more educated and older.
This post will focus on the changes in educational attainment over the past 50 years as well as the geographic distribution within the state. Politics in Colorado (like politics nationally) have come to be oriented around educational attainment.
Today, somewhat less than half of adult Coloradans have a four-year college degree, and the counties within the state that have the highest shares of college educated people are generally the same places that are most supportive of Democratic political candidates.
A note on the data used in this post: The data for this post mostly from the Current Population Survey (CPS) administered by the Bureau of Labor Statistics, the decennial censuses and the American Community Survey. These are large-sample, nationwide surveys that are administered to households throughout the year. Estimates from these surveys form the basis of a great deal of economic forecasting and analysis in the U.S. As with any survey, the estimates come with some error. I've pulled numbers from November for the 1976-2024 trend. and September for the 2025 estimate (As of this writing, November data had not been released) in the CPS, and education figures from the 1970-2000 censuses and more recent figures from the 5-year American Community Survey estimates.
The data were prepared and harmonized by IPUMS which provides an extraordinarily valuable service to researchers by making the data more accessible.
Most of these surveys conduct household-level interviews that record data for every member of the household. In the analyses reported here, I've restricted the sample to individuals who were 18 years or older at the time of interview unless otherwise noted.
Colorado compared to the rest of the country
The graphic below compares the share of adult Coloradans who have a college degree (the black solid line) and those who have only a high school diploma or less (the dashed black line) to the national trends (shown in grey).
In 1978, about one-in-five Coloradans had a college degree. This was about 5 percentage points more than the national average that year. In 2025, about 45% of adult Coloradans have a college degree. This is about 10 percentage points higher than the national average.
Educational attainment in Colorado and the national trend, 1976-2025
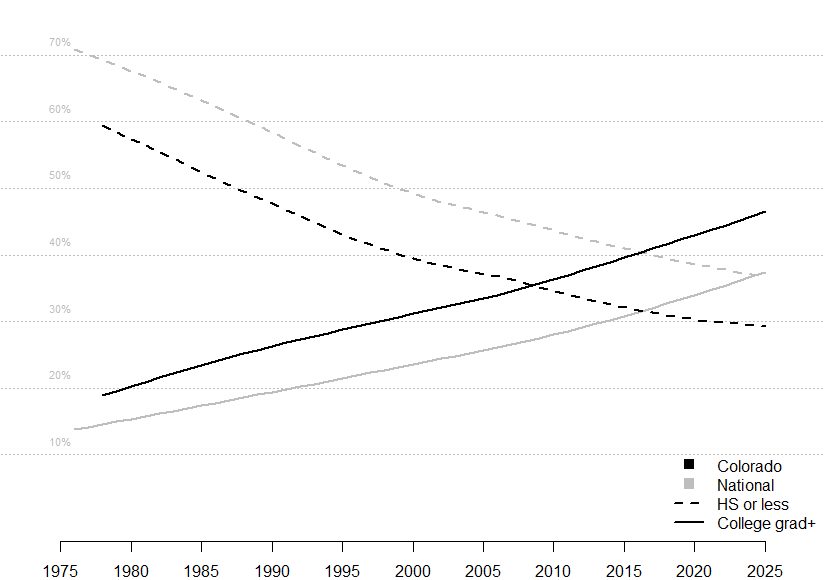
The share of Coloradans whose highest level of education is a high school degree has fallen precipitously during this period. In 1978, about 60% of Coloradans had no college education. That figure has fallen to about 30% today. Throughout this period the share of adults nationally with no college education was about 10 percentage points higher than the level in Colorado.
The changing relationship between educational attainment and presidential vote
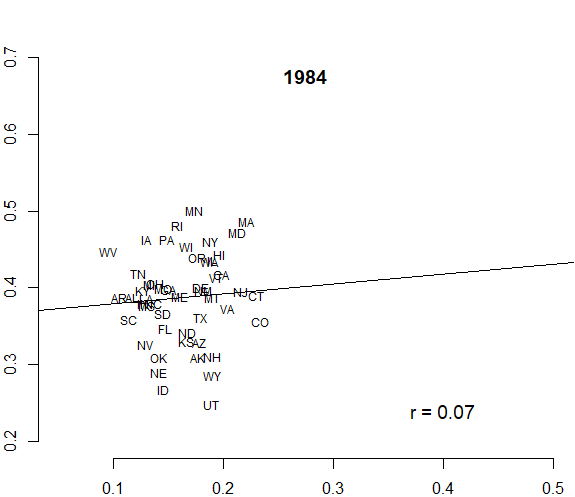
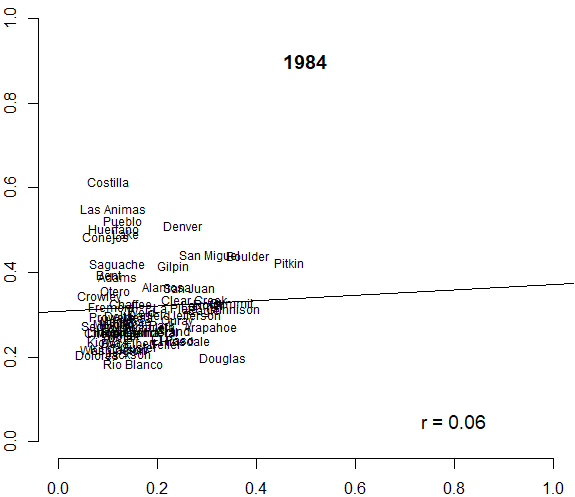
In the 1984 presidential election, there was virtually no relationship between the share of a state's population with a college degree and the share that voted for the Democratic candidate. One way of measuring the association between two variables is Pearson's correlation coefficient. This quantity ranges between -1 (a perfect negative association) and +1 (a perfect positive association). The Pearson's correlation between the 1984 presidential vote and the share of a state's population with a college degree in 1984 is 0.07.
Relationship between share of adult population with a college degree and Democratic vote, 1984
Twenty years later, in 2004, the association between the share of a state's adult population with a college degree and Democratic vote share in that state had increased substantially (Pearson's correlation of 0.59).
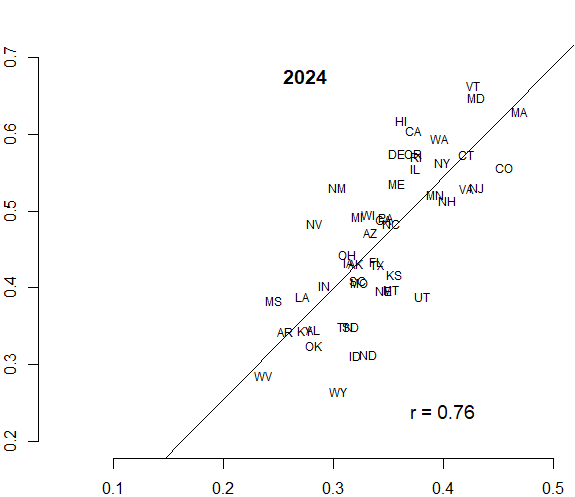
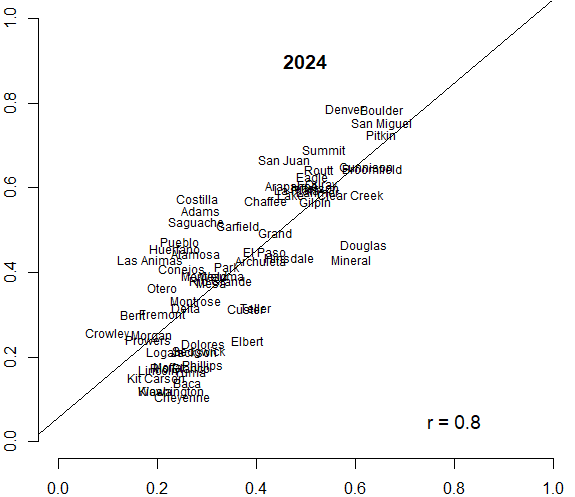
Today, the relationship between state-level educational attainment and presidential voting is very strong. Correlations of this magnitude (0.76) are almost unheard of in social science.
Relationship between share of adult population with a college degree and Democratic vote, 2024
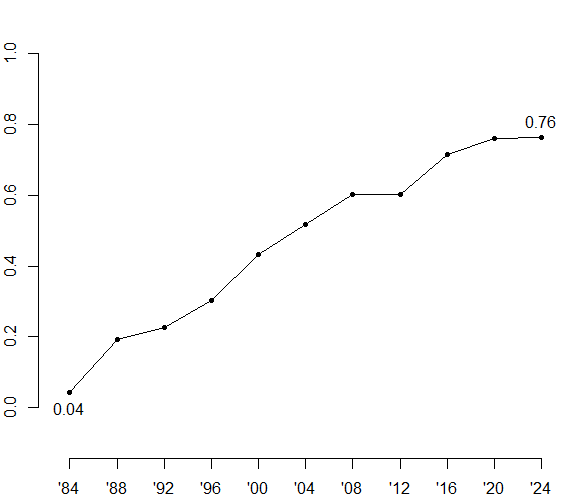
Many have commented on the so-called "diploma divide" in American politics. The chart below puts it into stark relief and shows how it has grown over the past 40 years. In 1984 there was no relationship between state-level educational attainment and state-level presidential vote. Over the past 40 years, the relationship has strengthened dramatically.
Correlation between state-level educational attainment and presidential vote, 1980-2024
So, to recap, the share of Coloradans with a college degree has increased substantially over the past 50 years (more than doubling) on pace with national trends (though educational attainment in Colorado has been consistently higher than the national average), and at the same time, the relationship between education and presidential vote has gone from non-existent in the 1980s to extraordinarily strong today. In Colorado these trends have paralleled one another, but education levels have been rising in every state in the nation during this period while Democratic vote has not. Indeed, one of the best predictors of the share of a state's population with a college degree in 2025 is the share of that state's population who had a college degree in 1980. The relative rankings of the states have remained largely the same over this period of time.
Something about one of these variables has changed.
Within-state variation in educational attainment
We can see this same national pattern playing out within Colorado. In the 1984 election, the share of adults within a county with a college degree was completely unrelated to the presidential vote share in that county.
Relationship between share of adult population with a college degree and Democratic vote, 1984 (Colorado counties)
By 2024, the two had become tightly linked.
Relationship between share of adult population with a college degree and Democratic vote, 2024 (Colorado counties)
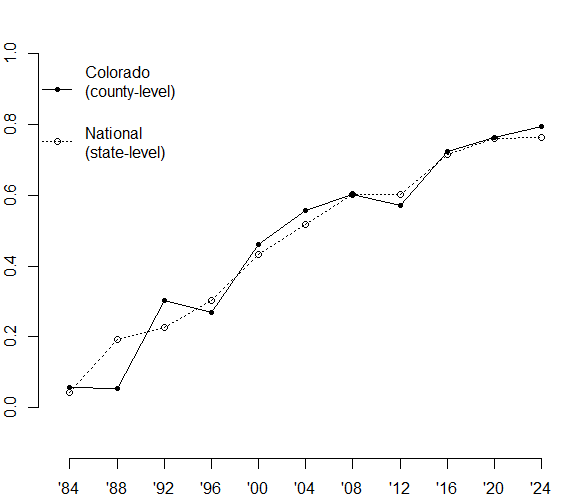
The graph below compares the change in the county-level association between educational attainment and presidential vote in Colorado to the national trend (at the state-level). The dotted line in the graphic below is the same as the solid one above. The solid line shows how the correlation between the share of adults in each Colorado county with a college degree and the Democratic share of the two-party vote in each county has changed over the same period.
It is amazing to me how similar the trends are – even at different levels of aggregation (county vs state).
Correlation between county-level educational attainment and presidential vote in Colorado, 1980-2024
An even more granular look
The New York Times Upshot team has done political analysts a great service by compiling and making available precinct-level election returns from 2020 and 2024. Critically, they have also released shapefiles (digital maps) that allow us to see the geographic variation in partisanship.
For the purposes of this post, I'm going to be looking at a measure of educational attainment mapped to the precinct-level election returns in 2024 in Colorado.
Relationship between the share of the adult population with a college degree and Democratic vote, 2024 (Colorado precincts)
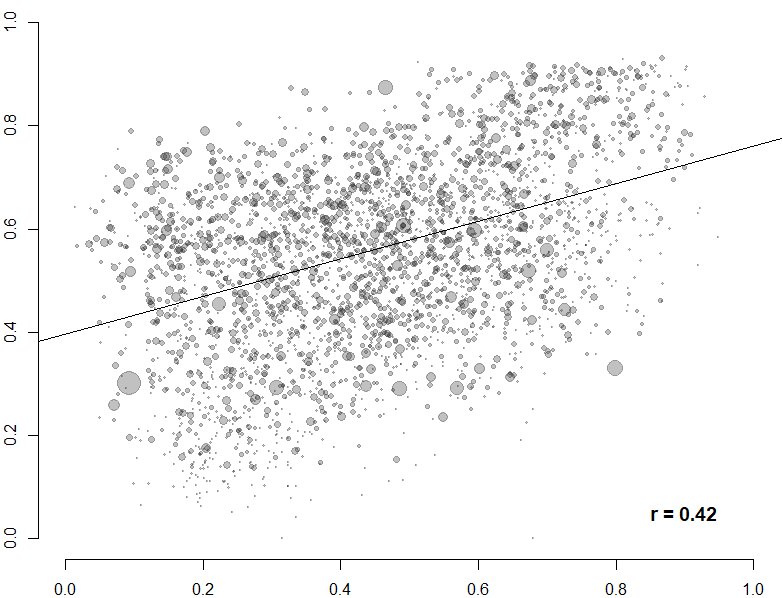
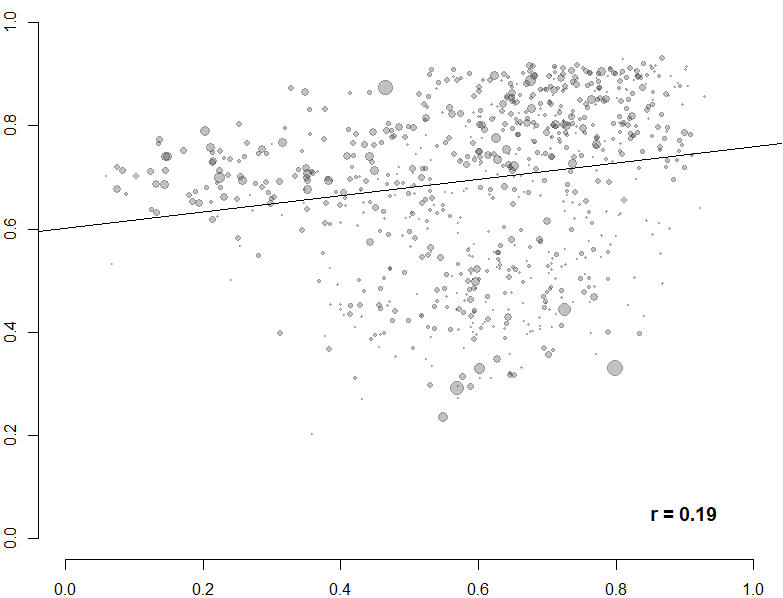
At the precinct-level, the relationship between education and vote share is substantially more modest than at either the county or state level. The plot below shows that the relationship gets even weaker when we subset out the precincts within counties that have an overall higher education level.
Relationship between the share of the adult population with a college degree and Democratic vote, 2024 (Colorado precincts within high-education counties)
Some final thoughts on the diploma divide
It is worth pausing to reflect on how unusual this high correlation between aggregate education levels and election returns is. When we look at individual-level data (and even more finely grained aggregations), we don't see nearly so tight a relationship between education and vote choice. While it is the case that college-educated voters are increasingly likely to support Democratic candidates, the size of the college graduate population and the margins among them are not so large as to account for the startlingly high correlation that we see at the aggregate level.
In 2024 according to the AP/Fox News VoteCast survey, 56% of voters with a college degree or more education supported Harris and 43% supported Trump. The figures for those without a college degree are the exact inverse. In Colorado a somewhat greater share of voters with a college degree supported Harris (61%), while Harris and Trump about evenly divided voters with no college degree.
If we go back and look at the relationship between education and voting in 1984, when only about 15% of the adult population had a college degree, exit polling indicates that 58% of this population voted for Reagan and 41% voted for Dukakis (the reverse of the relationship we see today). Despite a larger association with the vote at the individual level in this election, there was virtually no association between aggregate educational attainment in the states in 1984 and election results that year.
All of this suggests to me that it is not education levels per se that are the primary factor here. There is something else about these states and (at least in the case of Colorado, but I suspect elsewhere as well) places within states that is the real driver.
Next time - Racial and ethnic diversity in Colorado

